Oracle Inventory
• Defining part numbers
• Modeling organization structures
• Tracking perpetual inventory
• Maintaining accurate on-hand balances
• Planning material replenishments
• Forecasting anticipated demand
You must plan how Oracle Inventory represents your company’s inventory sites and business units. This includes defining organizations, locations, subinventories, and locators depending on your company structure. You also must plan how to implement certain parameters and what level of the structure controls them.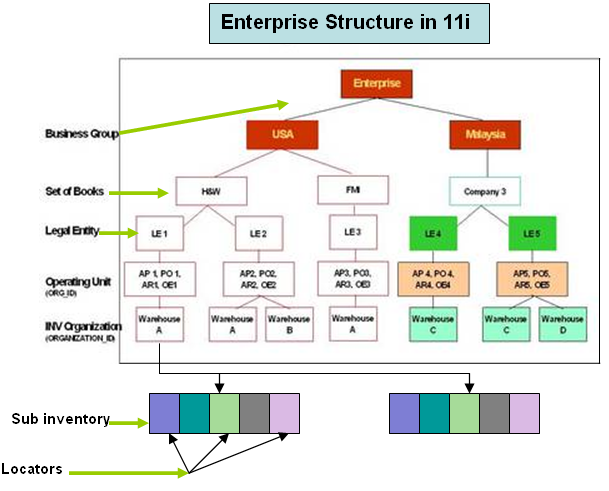
Multi-org often refers to an Oracle Applications setup used to enable multiple business units in a single install. With multi-org, a business enterprise may set up multiple business units with differing sets of books, operating units, and legal entities all within a single instance. With multi-org, goods my be sold out of one operating unit or legal entity and shipped out of another, and the system will process an intercompany sale to properly account for it.
Multi-org, however, should not be mistaken for installs with multiple inventory organizations. You do not have to use Oracle Applications multi-org to support multiple inventory organizations if all the inventory organizations share the same set of books, operating unit, and legal entity.
Location: A location is simply a name and address, and is assigned to an organization or used to indicate delivery information on a purchase order. You may define as many locations as you like, but only one location may be assigned to an inventory organization.
Business group is a group of companies that does business in different markets under common administrative or financial control whose members are linked by relations of interpersonal trust on the bases of similar personal ethnic or commercial background a business group.
Set of Books (SOB): The financial entity that represents the chart of accounts, fiscal calendar, and base currency. The SOB is set up in the General Ledger.
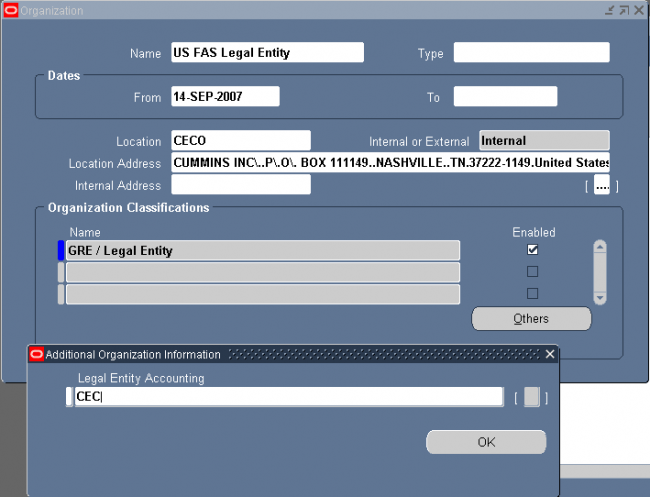
Legal Entity Organization: An entity used to represent a legal company. Fiscal and tax reporting are done at the Legal Entity level.
A legal employer is a legal entity that is responsible for employing people in a particular country. Therefore, if you employ people in a country, then you must have at least one organization classified as a legal entity and a legal employer.
The Configuration Workbench classifies an organization as a GRE/Legal Entity where your enterprise operates in a country, and classifies it as an Employer if you employ people in that country also. For example, you can have a legal entity in a country where you do business, but do not employ people in that country.
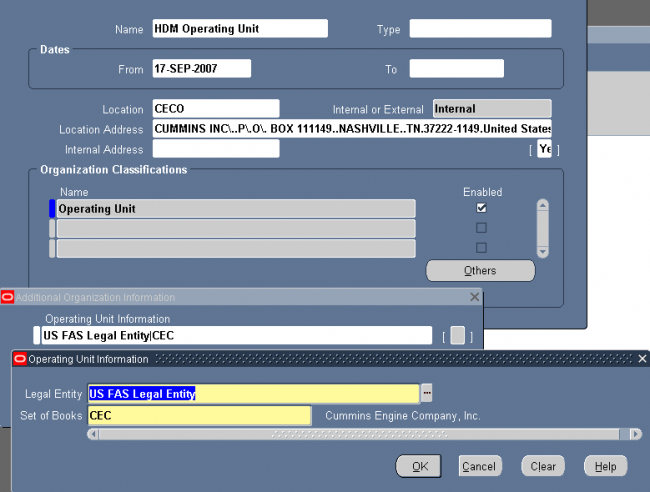
Operating Unit Organization: A business unit that shares a common Purchasing, Accounts Payable, Order Entry and Accounts Receivable setup. An operating unit may consist of multiple inventory organizations, with multiple manufacturing sites, distribution centers, and sales offices, but they share a common sales order and purchase order system. For example, a sales order may have lines shipping from different inventory organizations or a purchase order may have lines destined for different inventory organizations.
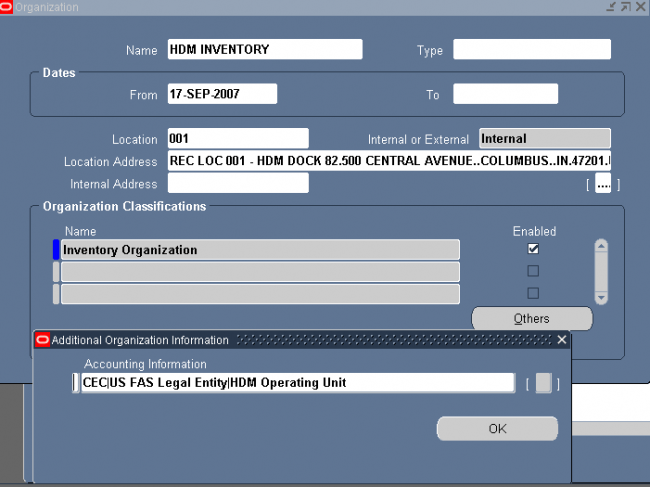
Inventory Organization: An entity used to represent a manufacturing or distribution site. Inventory organizations are where a user tracks on-hand balances, manufactures goods, and transacts the daily ins and outs of material movement. An inventory organization is the lowest level entity for costing goods, planning material requirements, and securing system access. Only a single address may be assigned to an Inventory Organization. An inventory organization is assigned a Set of Books which determines the chart of accounts, fiscal calendar, and base currency for all financial and value added activities that occur within the organization.
Inventory Organizations are also assigned to a Legal Entity Organization and an Operating Unit Organization.
A variation on the inventory organization is the master item organization. Generally, with Oracle Applications a single inventory organization is created and designated at the master organization. Items are defined first in the master organization, then enabled in other inventory organizations as necessary. Some of the item attributes are set as controlled at the master organization and therefore the attribute values cannot be updated within individual inventory organizations. Category sets may also be designated as master organization level. Cross-references are also master level only or master level optional as well.
Subinventory: Physical or logical locations for storing inventory. Subinventories are generally defined to represent the main stores area as well as stocking points on the production floor. Additional subinventories may be used to specify supply closets or cabinets and the cage area for discrepant material. Subinventories are flagged as to availability for planning (nettable), reservations, and available to promise checks, thereby determining the availability of the material stored in the subinventory. Subinventories are assigned material asset account numbers. As goods move in and out of a subinventory a transaction posts to the asset account.
Stock Locator: A physical area within a stockroom. The stock locator is a key flexfield that is often defined as a multiple segment flexfield with the segments representing the physical layout of a stockroom. For example, a stockroom may be laid out in rows of shelves with bins on the shelves, each numbered so that a row/shelf/bin combination would direct someone to a particular material storage compartment. Such an implementation would define a locator flexfield as a 3 segment flexfield with segments for row, shelf, and bin.
Attachment of LE/OU/INV with BG
We never attach any LE/OU/INV with BG in front end...but its available in HR_ALL_ORGANIZATION_UNITS in column Business_Group_ID..so the question is from where it comes?
First we create a Business Group. When ever we create a business group the system creates an organization with type businessgroup and attach a business group ID 'N' which is same as the organization ID for that Business group.
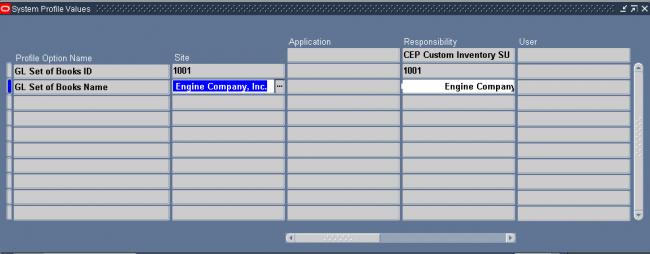
After that we attach the business group to a responsibility through the profile option HR : Business Group.
Next we create whenever we create a new LE/OU/Inv with one responsibility the system 'll attach the Business Group which is attached with the HR : Business group for that particular responsibility.

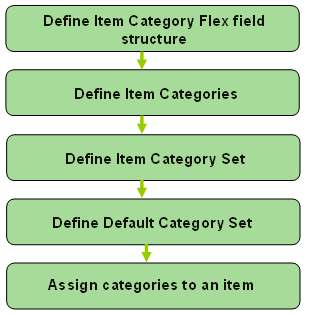
You can define multiple segment structures for the Item Categories Flexfield. Each segment structure may have its own display prompts and fields.
When you install or upgrade Oracle Inventory or Oracle Purchasing, Oracle provides two category flexfield structures by default: Item Categories and PO Item Category.
Each segment structure can display prompts and fields that apply specifically to a particular naming convention. For example, you might want one of your category sets to use two segments for the names of categories. Another item grouping scheme might use just one segment for the names of categories. You choose a flexfield structure for every category set and category that you define.
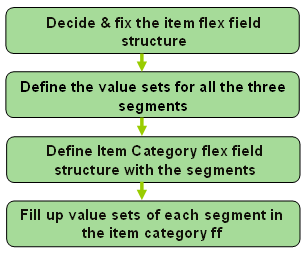
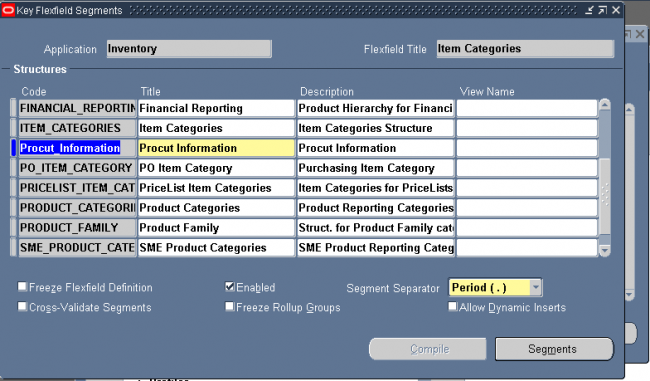
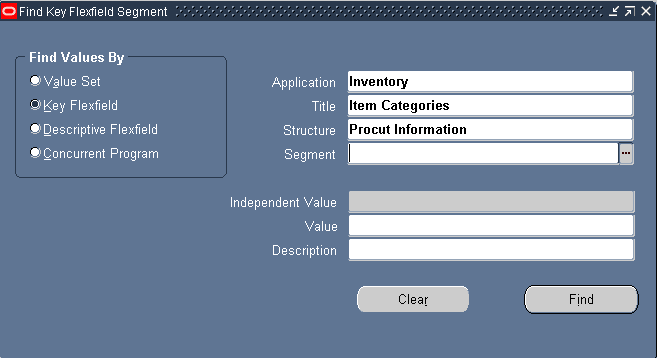
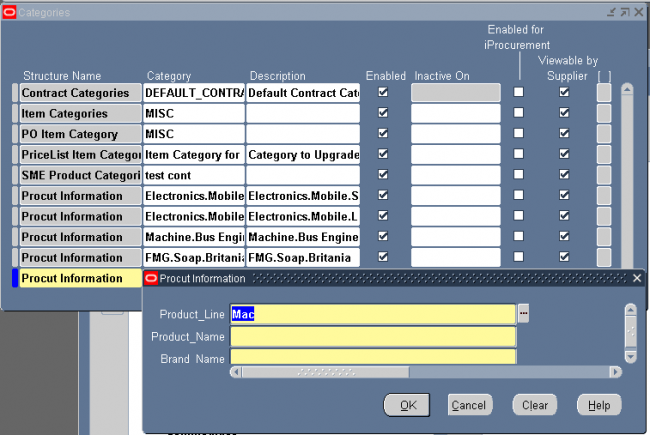
3. Define the item category flex field.
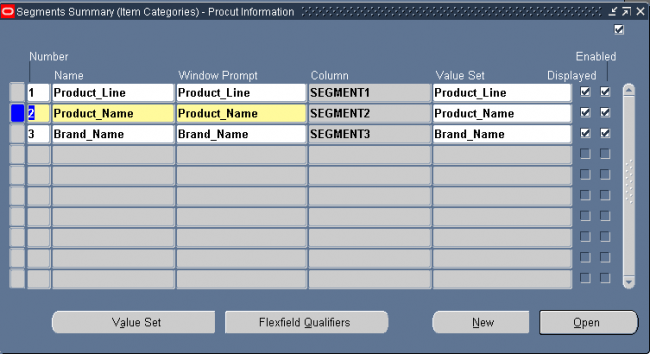
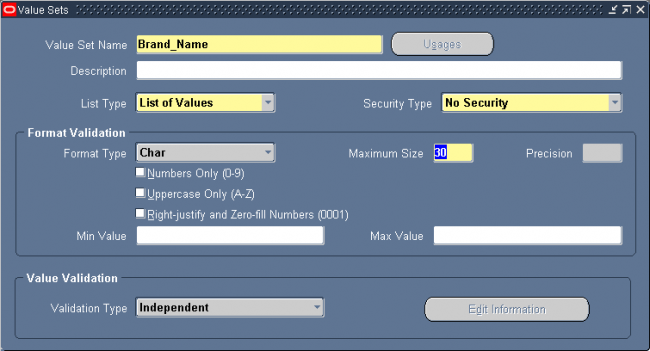
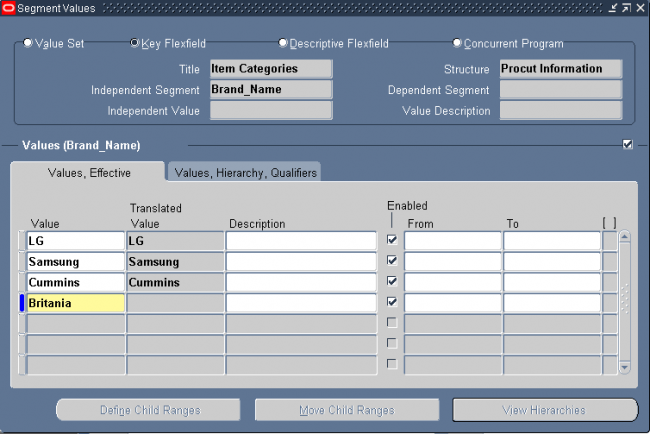
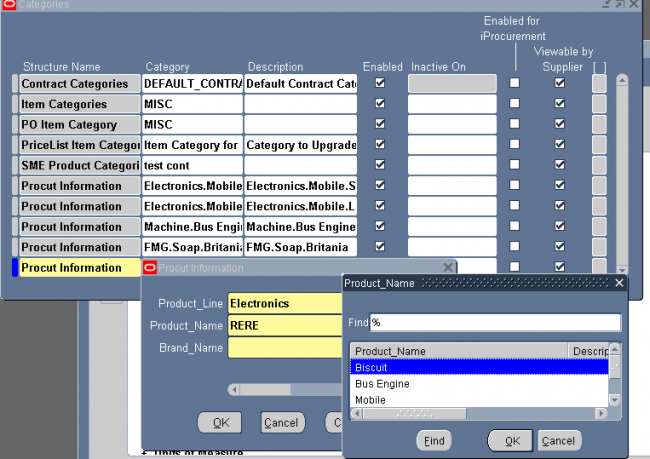
4. Filling up the value set of the stucture product information
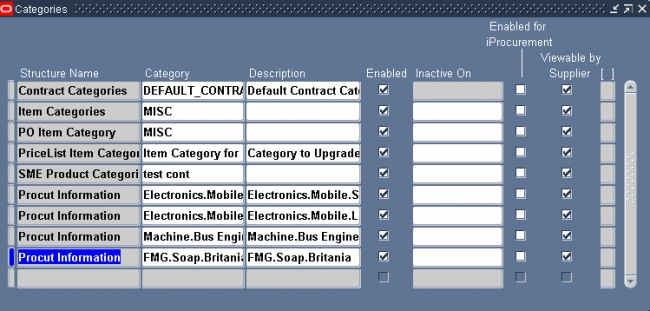
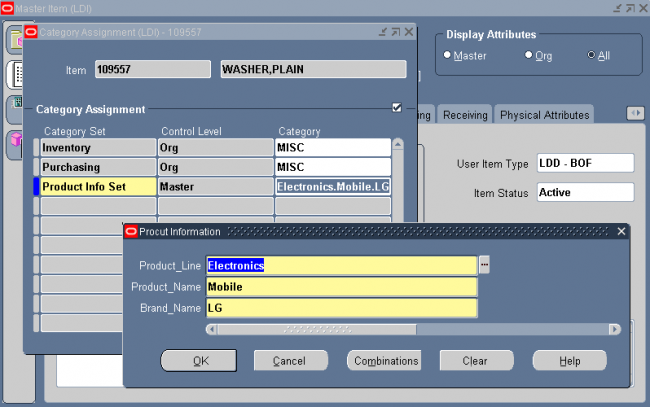
Enter a flexfield Structure Name, a unique Category (value) for each structure segment, and a unique description for the new category. If you want to make a category inactive, enter a date you want the category to be inactive on. Save your work.
If you choose a multi–segment flexfield structure you can assign a specific meaning to each segment. For example in our case the category "Electronics.Mobile.Samsung" means an item assinged to this category is a samusng brand mobile device of elcetroincs product group.
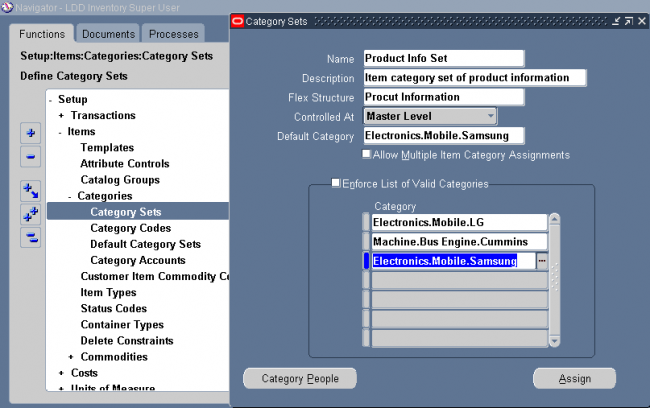
Category sets may be used as a means to develop custom lists of items on which to report and sort. You can also create other category sets such as John’s Priority or Jane’s Priority, with categories like high, medium, and low.
The category set Inventory is seeded when you install Oracle Inventory.
The category set Purchasing is seeded when you install Oracle Purchasing.
If you plan to use Order Management’s group pricing functionality with item categories, you must add the categories to the Order Entry category set.
Attention:
1. You must use this window to define valid categories for each purchasing category set before you can use Oracle Purchasing.
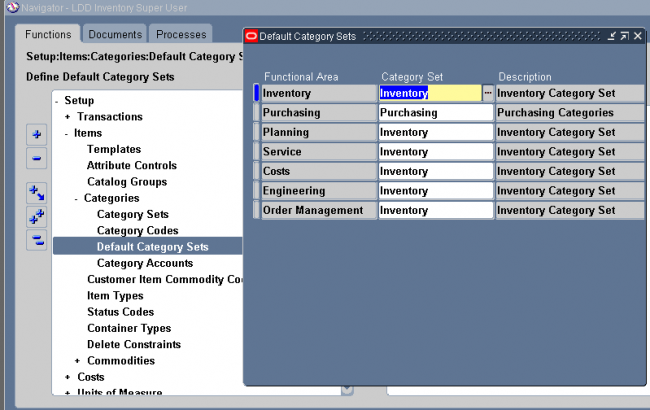
2. For the Controlled At level, if the item defining attribute of the functional area (e.g. Inventory’s is Inventory Item) is controlled at the Organization level, then the new default Category Set should also be controlled at the Organization level.
set to each of the following functional areas: Inventory, Purchasing, Order Management, Costing, Engineering, and Planning. Product Line Accounting is seeded with the Inventory category set. Inventory makes the default category set mandatory for all items defined for use by a functional area. If your item is enabled for a particular functional area you cannot delete the item’s corresponding default category set assignment. Default category sets are required so that each functional area has at least one category set that contains all items in that functional area.
You can enable an item for each functional area by using that functional area’s item defining attribute. An item defining attribute identifies the nature of an item. For example, what designates an item as an “engineering item” is the attribute Engineering Item. If a functional area’s item defining attribute is controlled at the Organization level, then that functional area may only have an Organization level default category set.
When you enable an item for a certain functional area, Oracle Inventory automatically assigns the item to the default category set of that functional area and the default category of that set. For example, if you set Inventory Item to Yes, then Inventory automatically assigns the item to the Inventory functional area’s default category set and default category.
You may change a functional area’s default category set under certain conditions. You should ensure that every item within the functional area belongs to the new default category set (which replaces the existing default category set). If the item defining attribute of the functional area is controlled at the Organization level then the new default category set should also be controlled at the Organization level.
When you enable an item in a functional area, the item is assigned to the default (mandatory) category set and default category of the functional area. You can override the category set’s default category. In addition, you can manually assign your item to an unlimited number of category sets. You may optionally assign an item to more than one category within a category set based on the category set definition.
When you assign your item to another organization Oracle Inventory copies Master level category sets, Organization level default category sets, and the associated categories assigned in the Item Master organization. This means that if you manually assign an Organization level category set to the item in the Master organization, Inventory does not copy over that Organization level category set when you assign that item to another organization.
After assigning an item to another organization you can disable the item for one or more functional areas in the new organization. However, Inventory does not remove the corresponding functional area’s default category set. For example, you may have set the value of the Purchased attribute to ”Yes” when you defined the item in the item master organization. When you assign this item to another organization Inventory copies over the ”Yes” value of the Purchased attribute and
therefore assigns the default category set of the purchasing functional area. In the new organization you may decide to set the value of the Purchased attribute to ”No.” After you disable the item for the purchasing functional area in the new organization, the item still retains the purchasing default category set. You may manually delete the purchasing category set in the new organization.
If you copy an item from another item with category sets defined at the Organization level, Inventory assigns the new item the default categories of the mandatory category sets, even if the original item did not have the default categories. This is because Inventory copies the values of the item defining attributes and not the category sets and categories themselves.
An item is a part or service that you purchase, sell, plan, manufacture, stock, distribute, or prototype. The following Oracle Applications use items:
• Oracle Inventory
• Oracle Purchasing
• Oracle Order Entry
• Oracle Cost Management
• Oracle Bills of Material
• Oracle Work in Process
• Oracle Master Scheduling/MRP
• Oracle Receivables
• Oracle Payables
• Oracle Services
• Oracle Engineering
• Oracle Quality
• Oracle Sales and Marketing
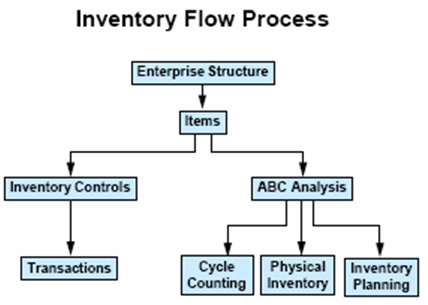
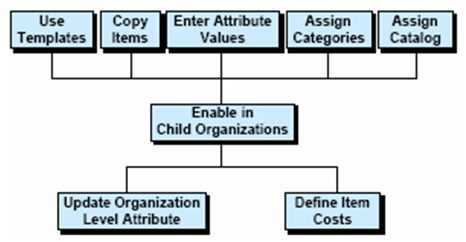
Below diagram describes the basic work that needs to be done before an item is ready to be used in inventory for transaction purpose.
You define items in one organization. To distinguish it from others, we call it the Item Master organization. Other organizations (child organizations) refer to the Item Master for item definition. After you define an item in the Item Master, you can assign it to any number of other organizations.
There is no functional or technical difference between the Item Master organization and other organizations. However, for simplicity, Oracle recommends that you limit the Item Master to just an item definition organization.
Oracle also recommends that you do not define multiple item masters. This can make item definition and maintenance confusing. In addition, multiple item masters are distinct entities, with no relationship to each other. You cannot associate items in one item master organization with another item master organization. You cannot copy items across item
master organizations.
To create the item master:
1. Use the Organization window to create the organization you want to use as the Item Master.
2. Use the Organization Parameters window to specify that organization as the Item Master. This is also where you assign child organizations to the Item Master. The item master organization uses itself as the Item Master.
Item attributes are information about an item, such as order cost, lead time, and revision control.
Item Defining Attributes - An item defining attribute identifies the nature of an item. What designates an item as an “engineering item” is the attribute Engineering Item, but what controls the functionality of the item are the collection of
attributes that describe it. You can buy an engineering item if you want to; simply set Engineering Item, Purchased, and Purchasable to Yes.
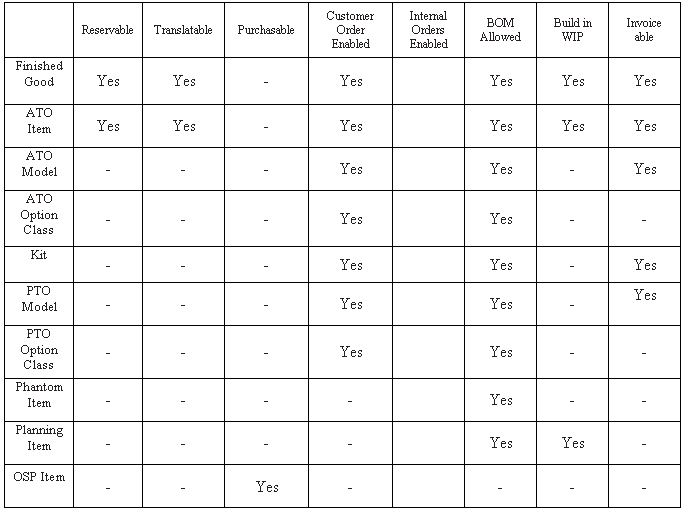
The following table presents item defining attributes:
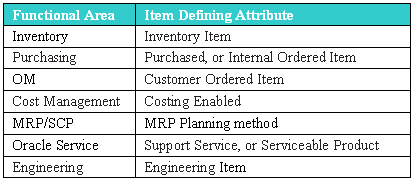
When you set an item defining attribute to Yes, the item is automatically assigned to the default category set of the corresponding functional area. For example, if you set Inventory Item to Yes, the item is automatically assigned to the default category set for the inventory functional area.
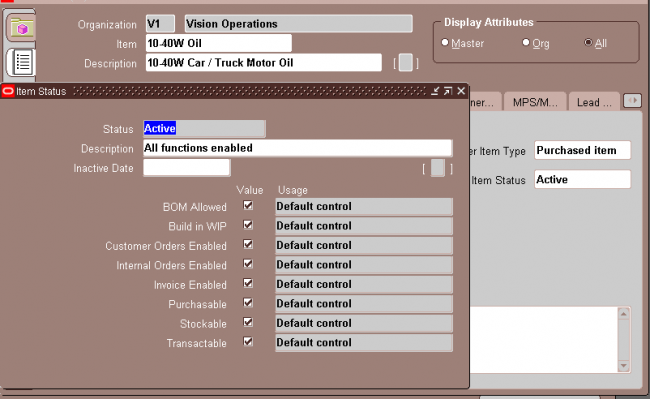
Item Status attributes are item attributes that enable key functionality for each item.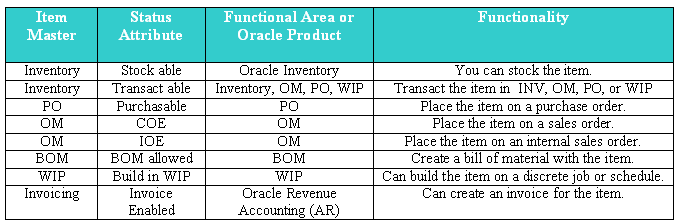
An item status Codes is defined by selecting the value check boxes for the status attributes.
Item Status Codes may be used to set or update the default values for certain item attributes. They can be used to control the functionality of an item. When you update the values for a status, all items that use that status will be updated also.
The Item Status Code controls certain item attributes designated as status attributes. Each status attribute has a Status Setting option. The option determines whether a status attribute value is set by the status code and is not updateable, defaulted and updateable, or not used when you define an item
Pending Status:
You can assign one or more pending statuses for an item, to be implemented on future dates. These statuses become effective on their assigned effective dates. You can also view the history of an item status.
(N) Items—>Master Items (M)—>Tools -> Pending Status
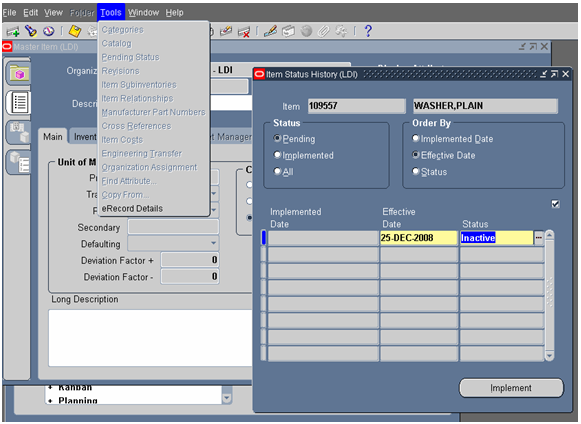
You can submit the Update item statuses with the Pending statuses of the concurrent program to update the status of all items with Pending statuses and current effective dates. When you submit this concurrent program, change its parameters so that it resubmits itself periodically, automatically updating item statuses to a Pending status, as effective dates become current. Pending statuses are used in the product development cycle.
Item Attribute Control determines whether you have centralized (Master level) or decentralized (Organization level) control of item attributes. Both status attributes and item status can be controlled at the item level or organization levels.
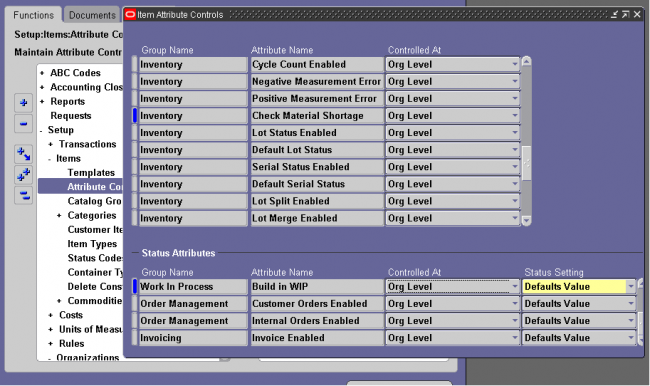
You can choose the status setting level of each status attribute in the Item Attribute Controls window. The status setting level determines whether you can update the value of each status attribute within an item status.
Sets Value: The status that you assign to the item loads a non updatable value into the status attribute. You can update the status attribute by changing the status that you assigned to your item.
Defaults Value: The status that you assign to the item loads a default value into the status attribute. You can update the status attribute as you define your item.
Not Used: The status that you assign to the item does not determine the value of the status attribute. You can enable or disable the status attribute as you define your item.
Status Setting Level Consideration: You have the flexibility to change individual status attribute settings. Using meaningful status codes gives you control over item usage.
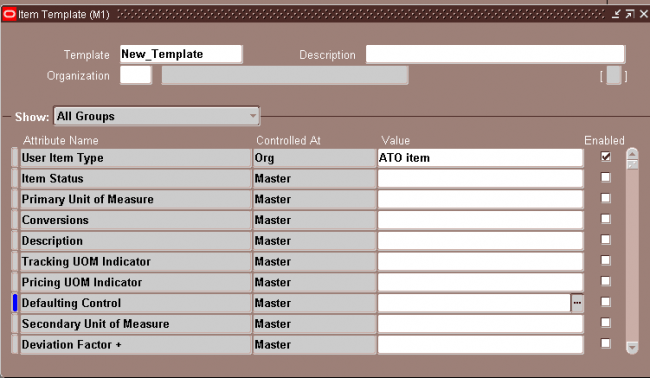
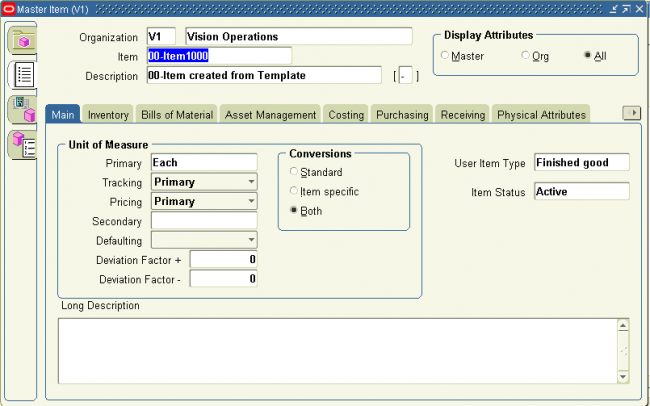
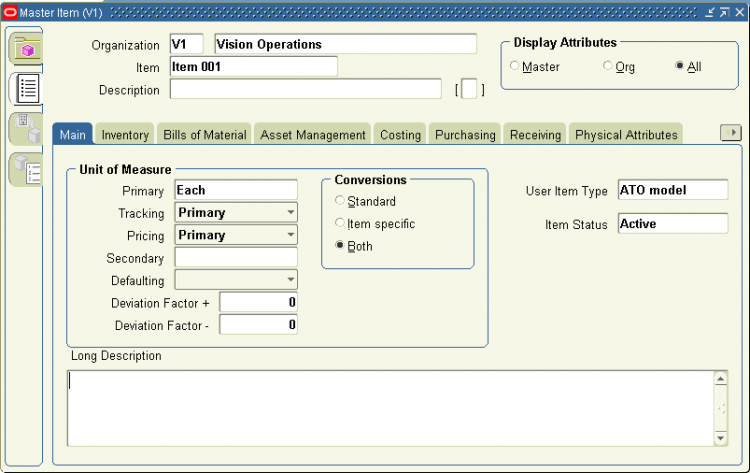
Templates are defined sets of attributes that you can use over and over to create many similar items. Templates make initial item definition easier. Oracle recommends that you use templates—either those Oracle provides or those you define—when you define your items.
Finished Good
ATO Item
ATO Model
ATO Option Class
Kit
PTO Model
PTO Option Class
Phantom Item
Outside Processing Item
Planning Item
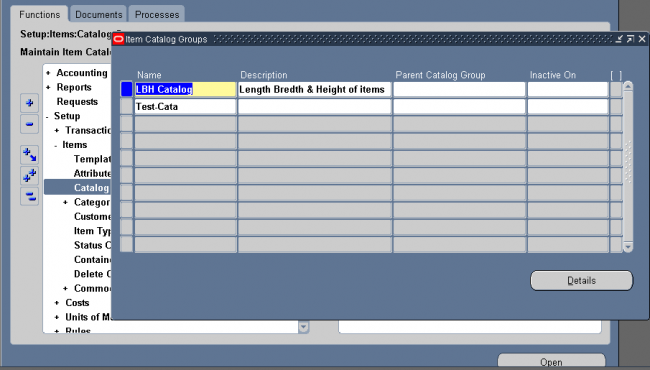
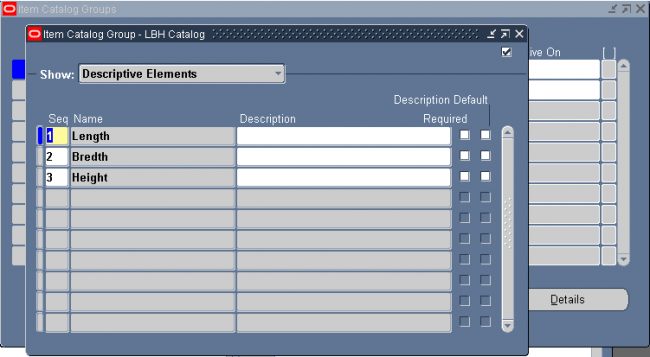
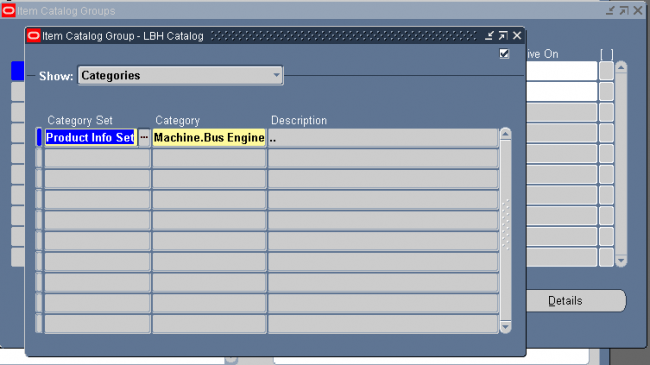
An item catalog group is a standard set of descriptive elements to which you assign items. Examples of catalog descriptive elements are color, shape, length, and so on. For example, a textile manufacturer might define pattern attributes such as color, size, texture, and style.
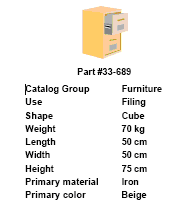 | Usage: An electronics company (say Samsung) can use the catalog to incorporate length, breadth and height of each mobile it produces. As the company Samsung also produces other electronics products such as TV, Refrigerator and etc. We should first create an item category as mobile and then create a catalog group as mobile-catalog with three catalogs length-breadth and height. |
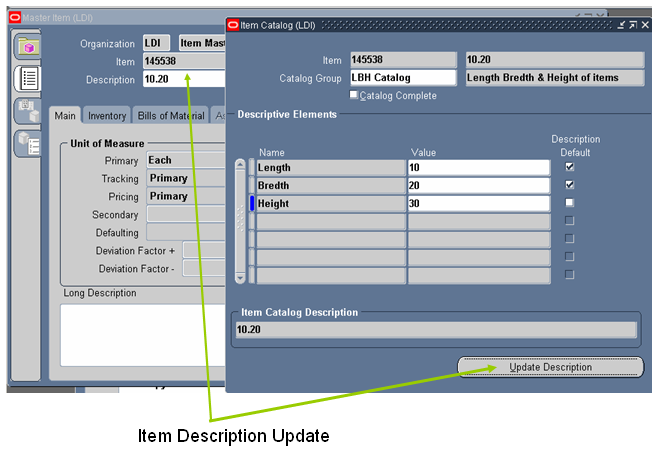
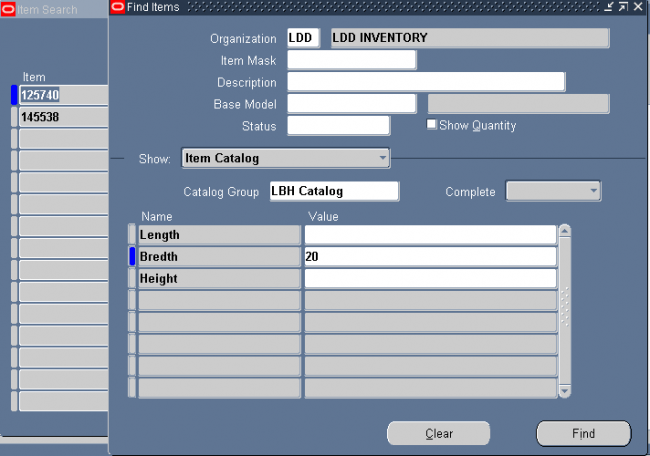
Seraching all the items with bredth 20.
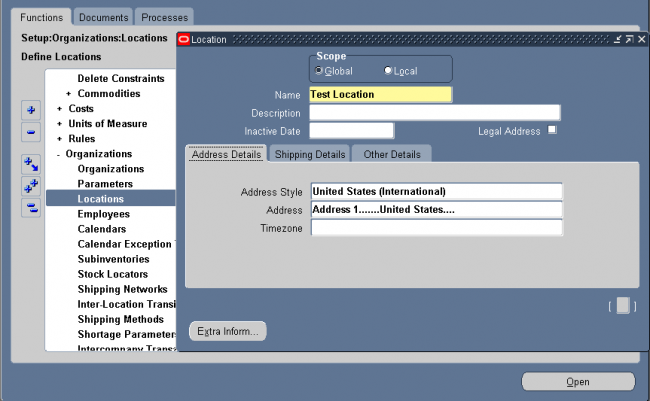
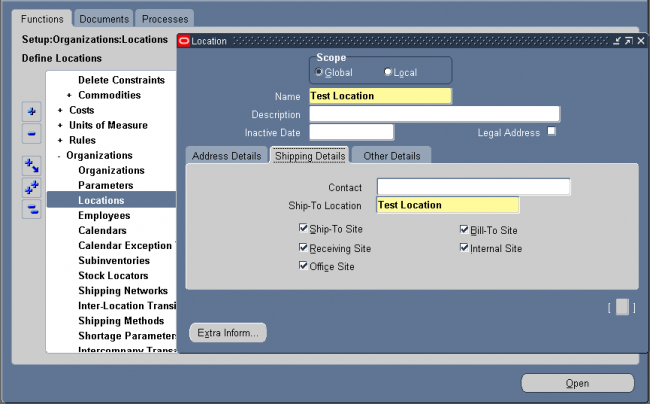
Use the Locations window to define ship–to, bill-to, receiving, office site, internal site & other location information for Purchasing documents.
Define the following organizaions as per the requirement of business
i. Business group
ii. Legal Entity
iii. Operating Units
iv. Organization
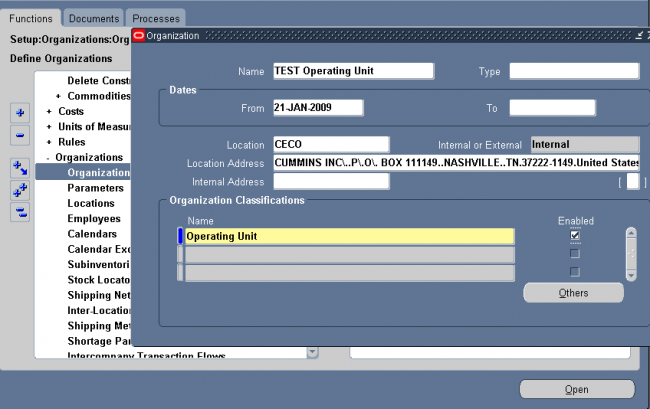
Enter Organization Classifications & Additional Information
1. Business Group
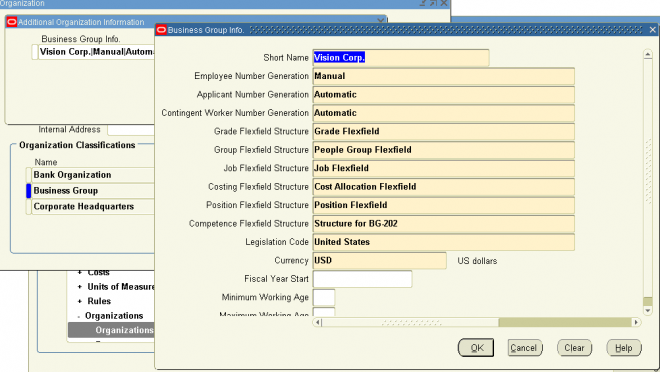
Business Group Information.
Budget Value Defaults.
Work Day Information.
Benefits Defaults.
PTO Balance Type.
Recruitment Information.
Payslip Information.
Self Service Preference Information.
2. Attaching Set of Books to Legal Entity
3. Attaching Set of Books & Legal Entity to Operating Unit
4. Attaching Operating Unit to organization
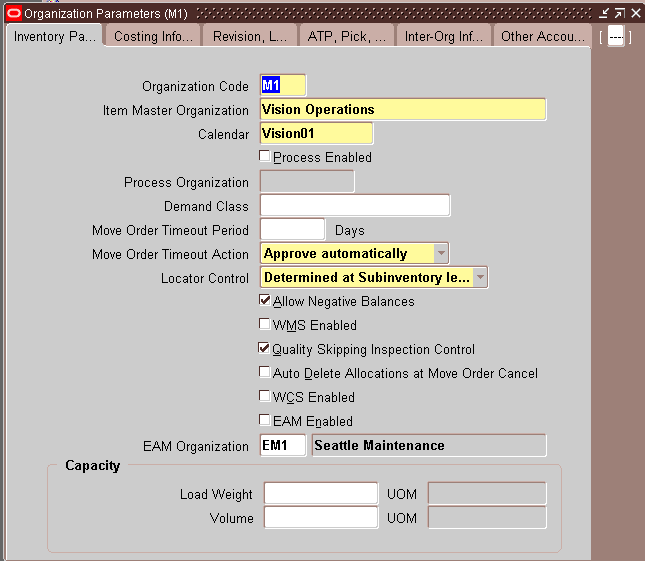
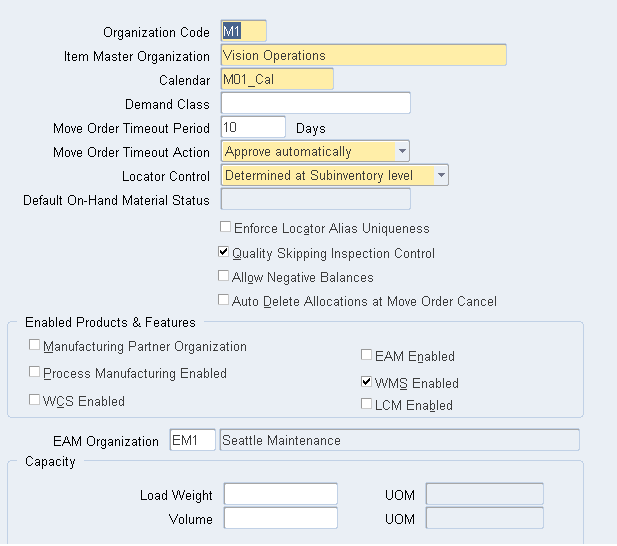
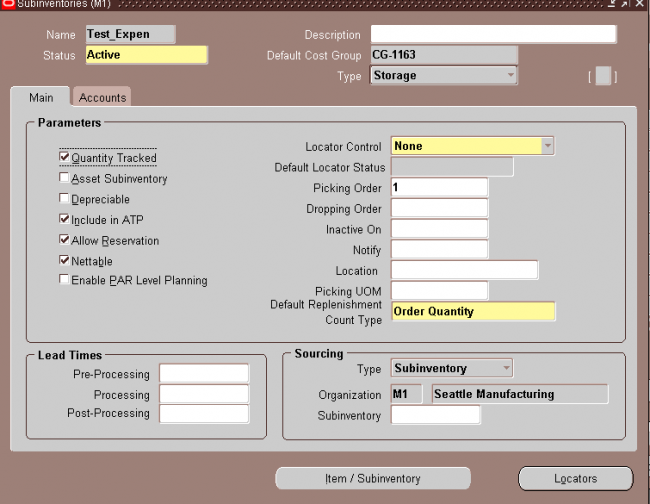
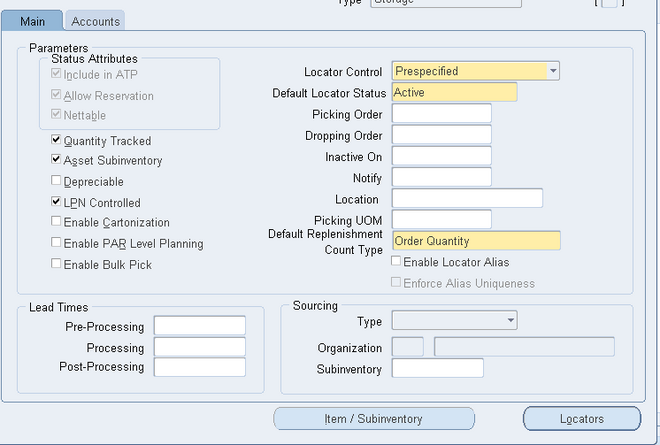
You can define and update default inventory and costing parameters for your current organization in the following areas:
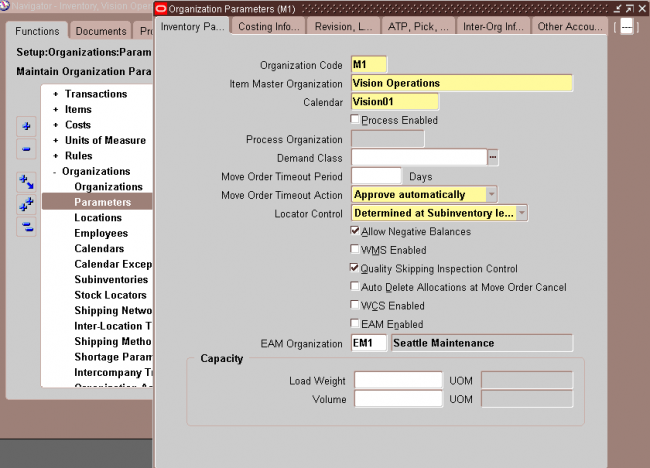
1. Enter an organization code for which you want to set up the organization parameter.
2. Select an Item Master organization. Oracle Inventory only defines items in the Item Master organization of the organization from which you enter the Items window.
3. Select a workday calendar. This is required when Oracle Master Scheduling/MRP and Oracle Supply Chain Planning is installed.
4. Optionally, select a demand class. Demand classes segregate scheduled demand and production into groups, allowing you to track and consume those groups independently. Oracle Master Scheduling/MRP and Oracle Supply Chain Planning uses this demand class during forecast consumption, and shipment and production relief.
5. In the Move Order Timeout Period field, enter the number of days a move order requisition can wait for approval.
The workflow approval process sends a notification to the item planner when a move order requisition requires approval. After the first timeout period, if the recipient has not approved or rejected the order, a reminder notice is sent. After the second timeout period, the order is automatically approved or rejected, depending on whether you select Approve automatically or Reject automatically in the Move Order Timeout Action field. If you want to bypass the move order approval process and automatically approve move order requisitions, enter 0 days in the Move Order Timeout Period field and select Approve automatically in the Move Order Timeout Action field.
6. Select a move order timeout action
Approve automatically: After the second timeout period, move order requisitions are automatically approved. Select this option and set the Move Order Timeout Period to 0 if you want to bypass the move order approval process and automatically approve move order requisitions.
Reject automatically: After the second timeout period, move order requisitions are automatically rejected.
7. Select a locator control option:
None: Inventory transactions within this organization do not require locator information.
Prespecified only: Inventory transactions within this organization require a valid, predefined locator for each item.
Dynamic entry allowed: Inventory transactions within this organization require a locator for each item. You can choose a valid, predefined locator, or define a locator dynamically at the time of transaction.
Determined at subinventory level: Inventory transactions use locator control information that you define at the subinventory level.
The costing organization that controls the costs in your current organization and the costing method are displayed. You cannot make changes to these fields.
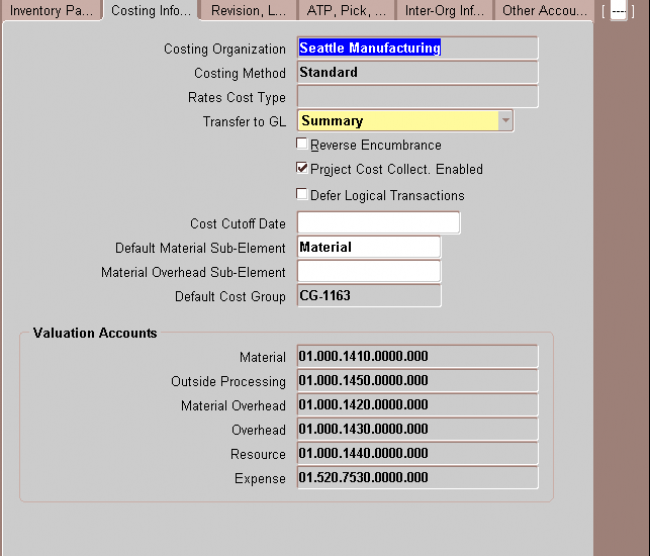
1. Costing Organization
2. Costing Method
3. Transfer to GL Indicate whether all transactions are posted in detail to the general ledger.
Caution: Transferring detail transaction distributions to the general ledger increases general ledger posting times due to the number of records created.
4. Reverse Encumbrance Indicate whether to reverse encumbrance entry upon receipt in inventory.
You normally select this option if you use encumbrances with Oracle Purchasing.
5. Optionally, enter a Cost Cutoff Date
If you leave this field blank, all available transactions will be costed,as usual. If you enter a date, all transactions prior to this date will be costed. All transactions on or later than this date will not be costed.
For inter–organization transfers, a standard costing, receiving organization will not cost a receipt if the sending organization did not already cost the transaction.
The default time is the first instant of the date. You can optionally choose another time.
The standard cost update process can be performed on the cost cutoff date. You can restart cost processing by changing the cutoff date to blank, or a future date.
6. Default Material Sub element
For standard costing, select a material sub–element that this organization uses as a default when you define item costs. For average costing, the default material sub–element you select can be used for cost collection when Project Cost Collection Enabled is set.
7. Material Over head Sub element
Optionally, select a Default Material Overhead Sub–Element from the list of values. During the Supply Chain Rollup process, when costs are merged from another organization, markup and shipping costs will use this value.
The supply chain cost rollup will complete successfully, regardless of whether this field is populated. If the Cost Rollup identifies an organization with a default material overhead sub–element not set up, a corresponding warning message will be printed in the log file.
8. Default Cost Group
Indicate the default cost group for the organization. This will default into the Default Cost Group field for each subinventory. If the WMS cost group rules engine fails to find a cost group, this cost group will be used.
9. Valuation Accounts
You choose a default valuation account when you define organization parameters. Under standard costing, these accounts are defaulted when you define subinventories and can be overridden. Under average costing, these accounts (except for Expense) are used for subinventory transactions and cannot be updated. For a detailed discussion of cost
elements.
Material An asset account that tracks material cost. For average costing, this account holds your inventory
and intransit values. Once you perform transactions, you cannot change this account.
Material Overhead An asset account that tracks material overhead cost.
Resource An asset account that tracks resource cost.
Overhead An asset account that tracks resource and outside processing overheads.
Outside processing An asset account that tracks outside processing cost.
Expense The expense account used when tracking a non–asset item.
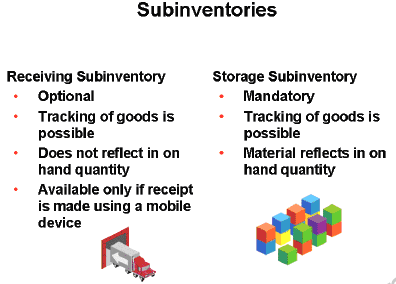
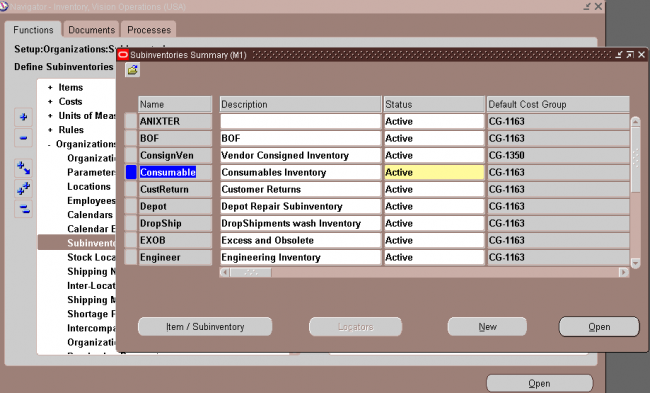
Subinventories are unique physical or logical separations of material inventory, such as raw inventory, finished goods, or defective material. All material within an organization resides in a subinventory. There are two types of subinventories within Warehouse Management, storage and receiving.
Storage subinventories are intermediate or final put away locations for material. Material that resides in a storage subinventory appears in on hand quantity, and is tracked by the system. The system can book orders against, and use manufacturing processes on material that resides in a storage subinventory. You must define at least one storage subinventory for your implementation.
Optionally, you can create receiving subinventories to track material in the receiving area. You use receiving subinventories when you want to track the material as soon as it enters the warehouse before an operator puts it away. Receiving subinventories enable managers to see where the material resides as soon as it enters the warehouse. Material located in a receiving subinventory does not appear in on hand quantity, and the system cannot reserve the material.
An operator can also only specify a receiving subinventory if they are using a mobile device to receive the material.
Note: Operators cannot transfer material from a storage subinventory to a receiving subinventory.
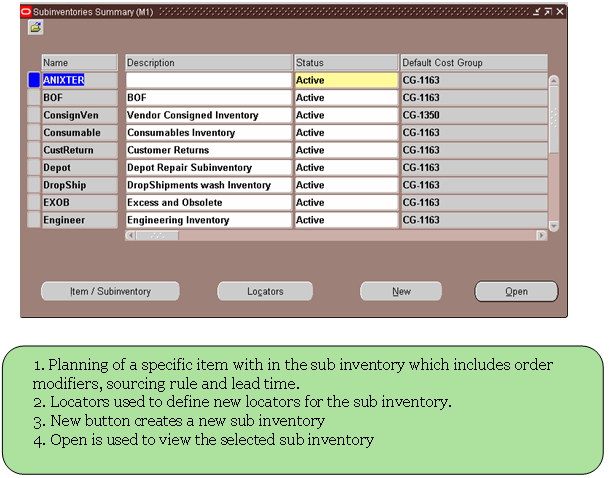
Select a source type for item replenishment.
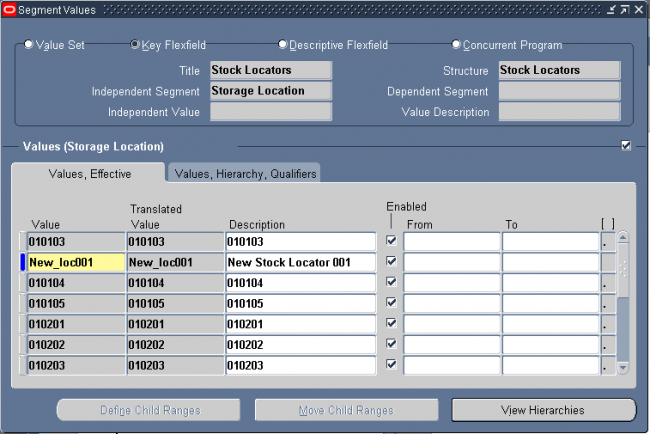
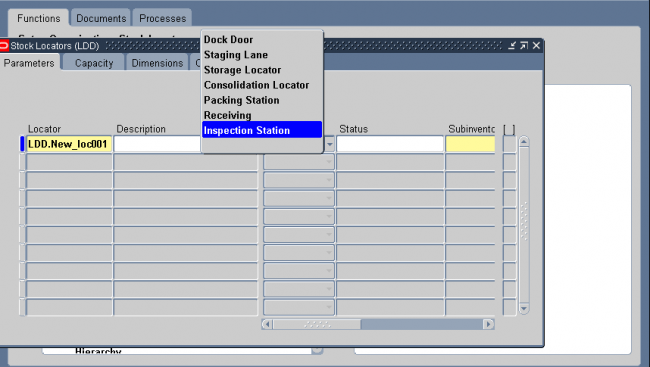
You use locators to identify physical areas where you store inventory items. Item quantities can be tracked by locator. Items can also be restricted to specific locators.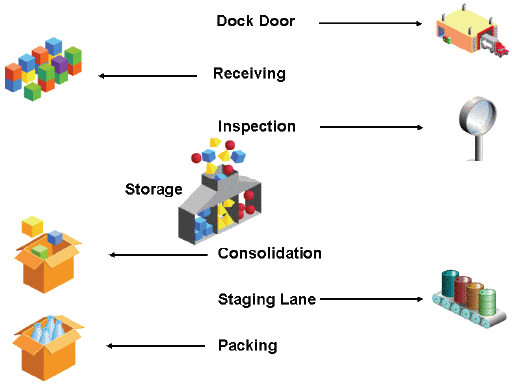
1. Add the segment values of the KFF stock locator.
Navigation : GL -> Financials -> Flexfields -> Key -> Values
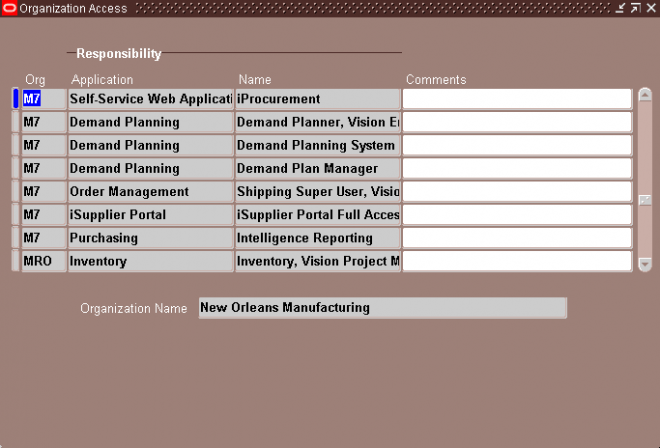
You can specify which organizations a responsibility can access by mapping responsibilities to organizations. Once this mapping is set up, a user logging into an Oracle Manufacturing product is restricted to the organizations mapped to the responsibility chosen. The Change Organization window is restricted as well.
Attention: Until you assign an organization to a responsibility in this window, all responsibilities have access to all organizations. Once you have restricted any responsibility to an organization, you must then explicitly define the organizations which all responsibilities can access.
Attention: This feature does not restrict access once the user is in the product. Users with access to functions that cross multiple organizations (such as ATP, Inter–organization Transfers, Item Search, Multi–organization Quantity Report, and so on) can still specify any valid organization when running these functions.
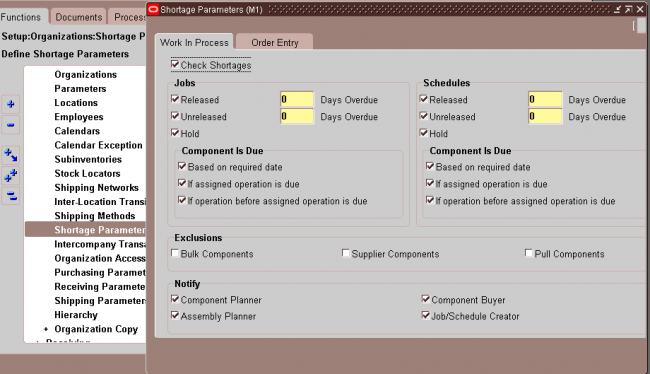
You can enable the system to send material shortage alerts and shortage notifications when a material shortage occurs in an organization. A material shortage occurs whenever unsatisfied demand exceeds available quantity for incoming supply of material.
The concept of customer item is to link the customer item with the inventory item of the organization so that the customer can order with their customer item for which we have a refernce to the inventory item. To facilitate the process we use commodity code to group all the customer items.
A customer item defined at the Customer level is recognized across all address and address categories for that customer. If you ship an item to multiple customer ship–to sites that have been grouped as an address category, you can define the customer item for that address category. You would define a customer item at the address level if you ship the item to only one ship–to site for that customer.
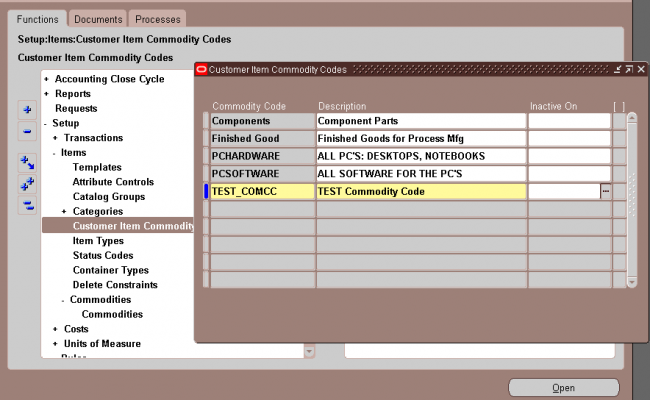
Commodity Codes
Customer Item Commodity Codes are used to group customer items and can be entered during the definition of customer items.
Navigation : INV -> Setup ->Items -> Customer Item commodity code.
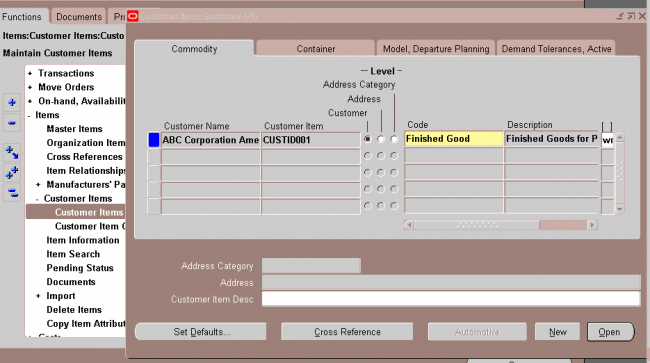
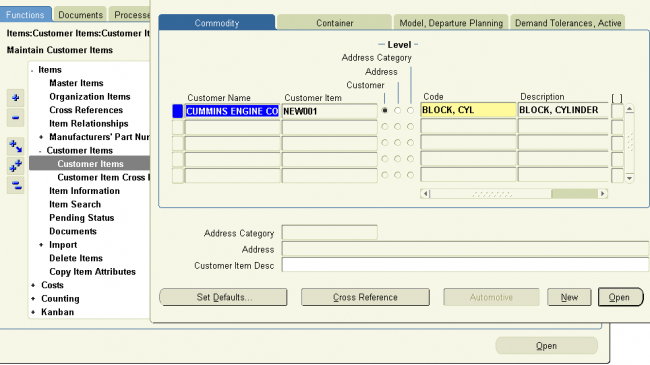
Customer Item
1. Select one of the existing Customer Names (in the Details window, you can use either Customer Name or Customer Number,).
2. Select the Definition Level: Customer, Address Category, or Address.
A customer item defined at the Customer level is recognized across all address and address categories for that customer. If you ship an item to multiple customer ship-to sites that have been grouped as an address category, you can define the customer item for that address category. You would define a customer item at the address level if you ship the item to only one ship-to site for that customer.
For the Address Category definition level, enter the address category.
For the Customer Address definition level, enter the customer address.
3. Enter the Customer Item number and description.
4. In the Commodity tabbed region, you can assign the customer item to a Commodity Code.
5. In the Container tabbed region, you can enter the default master and detail containers for this customer item as well as the minimum fill percent for the container.
6. In the Model, Departure Planning tabbed region, you can reference a customer item as a Model by entering the inventory item number of an existing Model item (the BOM Item Type attribute is set to Model).
You can also check Required to indicate that items must be departure planned before they released and Before Build to indicate that ATO items must be departure planned before they are built.
7. In the Demand Tolerances, Active tabbed region, you can enter positive and negative tolerance percentages and select or deselect the Active check box.
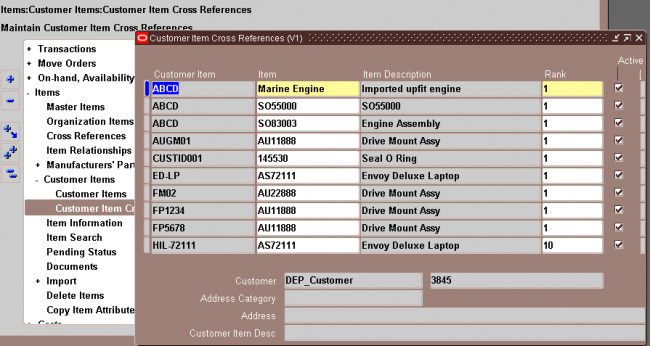
Customer Item Cross References
Use the Customer Item Cross References window to define and update cross references between your inventory items and the customer item numbers defined in the Customer Items Summary/Detail windows.
You can also navigate to this window by selecting the Cross Reference button in the Customer Items Summary window. Inventory displays the existing cross references for the customeritem on the current line in the Customer Items Summary window, and you can add new cross references by selecting a new row.
Enter the Rank as a positive number. To permit alternate or substitute inventory items for a customer item, you can define multiple cross references to inventory items for a single customer item. In these cases, you must specify the Rank of the cross reference. The highest rank is 1.
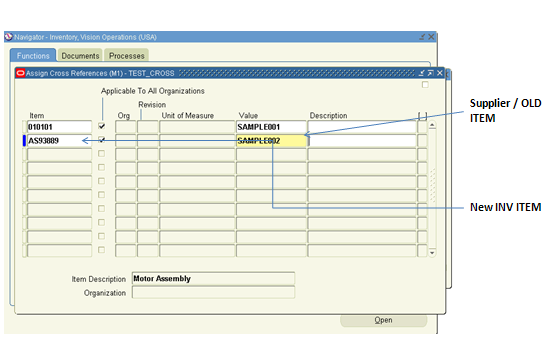
Cross–reference types define relationships between items and entities such as old item numbers or supplier item numbers. For example, you can create a cross–reference type Old to track the old item numbers, and a type Supplier to track supplier part numbers.
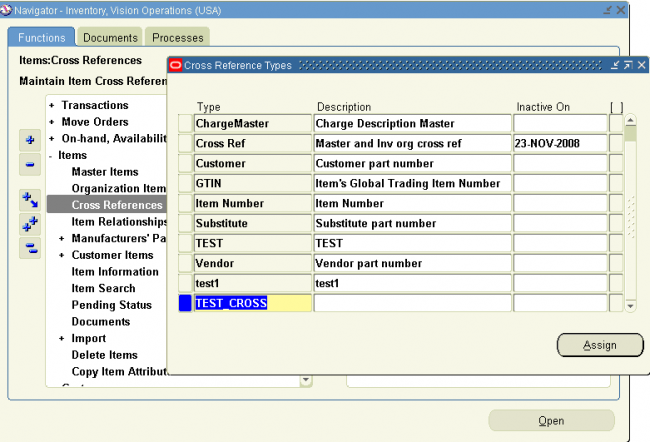
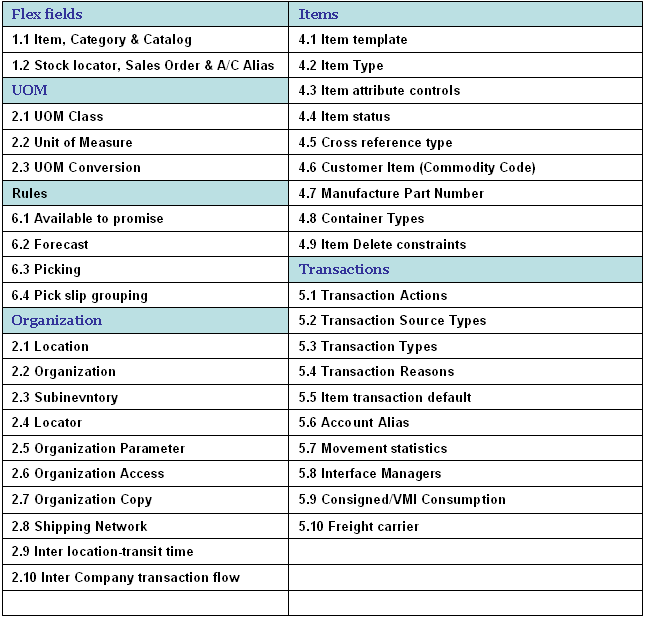
You must set certain controls and reference options before defining items. These enable you to maintain, group, reference, query, and delete your items. Once you have defined items, you can set up other parameters, such as item cross references, to control the use of items.
You define items in one organization. To distinguish it from others, we call it the Item Master organization. Other organizations (child organizations) refer to the Item Master for item definition. After you define an item in the Item Master, you can assign it to any number of other organizations.
There is no functional or technical difference between the Item Master organization and other organizations. However, for simplicity, Oracle recommends that you limit the Item Master to just an item definition organization.
Oracle also recommends that you do not define multiple item masters. This can make item definition and maintenance confusing. In addition, multiple item masters are distinct entities, with no relationship to each other. You cannot associate items in one item master organization with another item master organization. You cannot copy items across item master organizations.
To create the item master:
1. Use the Organization window to create the organization you want to use as the Item Master.
2. Use the Organization Parameters window to specify that organization as the Item Master.
Item Master Business Example
Suppose you have a distribution warehouse and a manufacturing factory. In the warehouse, the item has independent demand and is min–max planned. In the factory, the item is MRP planned and built.
Using an Item Master with a warehouse and a factory as the other organizations, you define the item just once—in the Item Master. Next, you assign the item to both the warehouse and the factory. Finally, you change the planning and build attributes in each organization to
describe the different behavior of the items in those organizations. You do not have to change any other information about the item; in fact, because information such as unit of measure, description, and so on is maintained at the Master level, you know it is consistent in each organization
Inventory Attribute Group
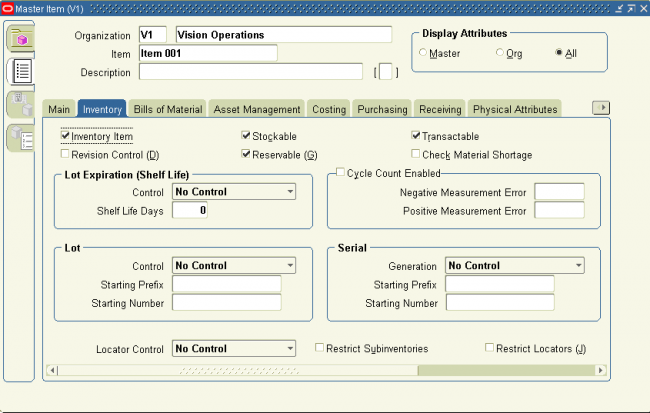
Following are the Inventory attributes and their possible values. You set these attributes when defining or updating items.
Following are the Order Management attributes and their possible values. You set these attributes when defining or updating items. 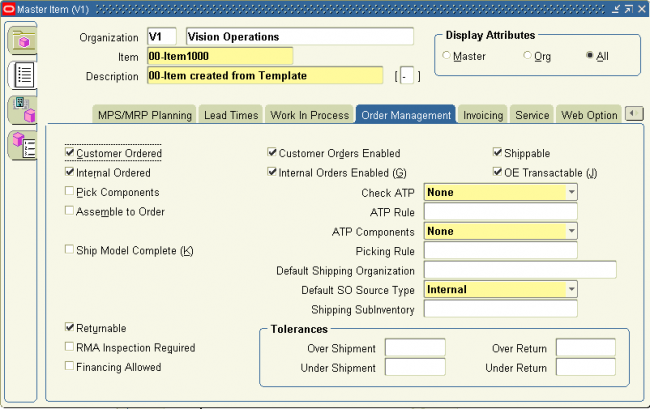
Customer Ordered
Indicate whether to allow an item to be ordered by external customers. You can add any customer orderable items to price lists in Oracle Order Management. This attribute must be turned off if the BOM Item Type attribute is set to Planning.
If you turn this attribute on, you can temporarily exclude an item from being ordered by turning Customer Orders Enabled off. This is an item defining attribute. If you turn this attribute on, the item is automatically assigned to the default category set for the Oracle Order Management functional area.
Customer Orders Enabled
Indicate whether an item is currently customer orderable. If you turn this attribute on you can specify the item in the Enter Orders window in Oracle Order Management.
You can initially define an item with Customer Ordered Item turned on and Customer Orders Enabled turned off. This means prices can be defined for the item, but no orders can be placed for it.
Internal Ordered
Indicate whether to allow an item to be ordered on an internal requisition.
If you turn this attribute on, you can temporarily exclude an item from being ordered on an internal requisition by turning Internal Orders Enabled off.
This is an item defining attribute. If you turn this attribute on, the item is automatically assigned to the default category set for the Oracle Purchasing functional area.
Internal Orders Enabled
Indicate whether you can currently order an item internally. If you turn this attribute on, you can specify the item on an internal requisition, if Internal Ordered Item is also on.
If you turn Internal Ordered Item on, you can temporarily exclude an item from being ordered on an internal requisition by turning this attribute off.
This attribute is optionally set by the Item Status code.
Shippable
Indicate whether to ship an item to a customer. Shippable items are released by Oracle Shipping Execution’s Pick Release program, creating confirmable shipping lines, and are printed on the pick slip. A warning is issued if you change the value of this attribute when open sales order lines exist.
This attribute must be turned off if the BOM Item Type attribute is set to Planning.
OE Transactable
Indicate whether demand can be placed for an item by Oracle Order Management, and whether shipment transactions are interfaced to Oracle Inventory. Most items with Shippable turned on also have OE Transactable turned on. For items you do not ship, you may still want OE Transactable turned on if you use the items in forecasting or planning.
If you also want to reserve the item, turn Reservable on. A warning is issued if you change the value of this attribute when open sales order lines exist. You cannot turn this attribute off if demand exits.
Pick Components
Indicate whether an item has a bill of material with options, classes, or included items picked from finished goods inventory. Pick–to–order items must have this attribute turned on. Assemble–to–order items and items without a bill of material must have this attribute turned off.
Assemble to Order
Turn this attribute on if an item is generally built for sales order demand; a final assembly work order is created based on sales order details. You must turn on this attribute if you auto create requisitions.
An item cannot have Pick Components turned on and this attribute turned on at the same time.
Returnable
Indicate whether to allow customers to return an item. If an item is returnable, you can enter it on the Returns window in Oracle Order Management. Order Management uses this attribute along with Stockable and Transactable to determine which authorized returned items
you can physically receive into inventory.
RMA Inspection Required
Indicate whether inspection is required for items returned by the customer. The item then must be separately transferred to inventory.
Credits are never automatically generated by Oracle Order Management for customer return items awaiting inspection.
Financing Allowed
Indicate whether a customer can finance this item.
ORDER DETAILS
Check ATP
Select Check Material Only, Check Material and Resources, Check Resources Only, or None to indicate whether to check available to promise and/or capable to promise information when placing demand.
This attribute also determines whether you can view component ATP information for material requirements in Work in Process.
ATP Components
Indicate whether to include, in available to promise checking, additional components in the bill of material for ATO and PTO items. These components are included in ATP checking if Check ATP for the component is turned on.
ATP Rule
Enter a user–defined available to promise rule. ATP rules define supply and demand sources, time–fence parameters, and available–to–promise calculation methods. You can give ATP rules meaningful names, such as ATO ATP Rule.
If there is no ATP rule for the item, the organization’s default ATP rule is used.
Default Shipping Organization
Enter the Oracle Shipping Execution primary shipping organization. This organization defaults to the Enter Orders window if Item is the source attribute of the Warehouse object in the standard value rule set for the order. This organization defaults to the Enter Returns window if a receiving warehouse is not defined on the customer or order type.
Default SO Source Type
This item attribute determines if an item is to be drop–shipped. If the value is internal, the item will not be drop–shipped. If the value is external, the item will be drop–shipped.
Picking Rule
Enter the picking rule that defines the order in which subinventories, locators, lots, and revisions are picked. This rule will not be employed in WMS enabled organizations. Oracle Warehouse Management picking rules will be used.
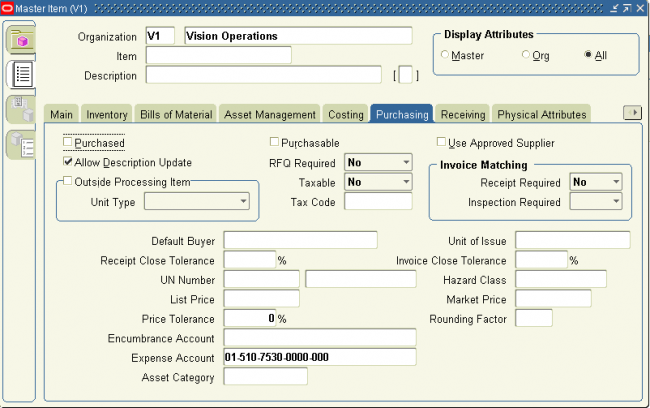
Following are the Purchasing attributes and their possible values. You set these attributes when defining or updating items.
Purchased
Indicate whether to purchase and receive an item. Turning this option on allows you to set the Purchasable attribute.
This is an item defining attribute. If you turn this option on, the item is automatically assigned to the default category set for the Oracle Purchasing functional area.
If an item is vendor managed, you must turn on this option.
Purchasable
Indicate whether to order an item on a purchase order. You can set this only when Purchased is turned on.
Turning Purchasable off allows you to temporarily restrict the ability to buy. This attribute is optionally set by the Item Status code.
RFQ Required
Indicate whether to require an item quotation when requesting an item. Oracle Purchasing defaults this value on requisition lines for this item. Leave this field blank if you want Inventory to use the value defined in the Purchasing Options window for transactions involving this item.
Taxable
Indicate whether the supplier charges a tax. Oracle Purchasing uses the taxable status together with the tax code you associate with a location to determine whether a purchase order shipment is taxable, and what the tax code that applies to this shipment is. Leave this field blank if you want Inventory to use the value defined in the window for transactions involving this item.
Tax Code
Select the appropriate tax code for the item. The tax code shows the tax authorities and rates that are available to use for this item. You must select the taxable attribute to enable this field.
Receipt Required (Three–Way Invoice Matching)
Indicate whether you must receive an item before you can pay the invoice. Leave this field blank if you want Inventory to use the value defined in the Purchasing Options window for transactions involving this item.
Inspection Required (Four–Way Invoice Matching)
Indicate whether to inspect an item upon receipt from the supplier, before paying the corresponding invoice. Leave this field blank if you want Inventory to use the value defined in the Purchasing Options window for transactions involving this item.
Outside Processing Item
Indicate whether you can add the item to an outside processing purchase order line. You can turn this option on only if Purchased is also on. In addition, this option controls whether you can attach an item to a resource in the Resource window.
Outside Processing Unit Type
Select an option to determine the quantity of an outside processing item you requisition, purchase and receive:
Assembly You purchase an outside processing item based on the number of assemblies you ship to the supplier.
Resource You purchase an outside processing item based on the number of assemblies times the resource usage rate or amount.
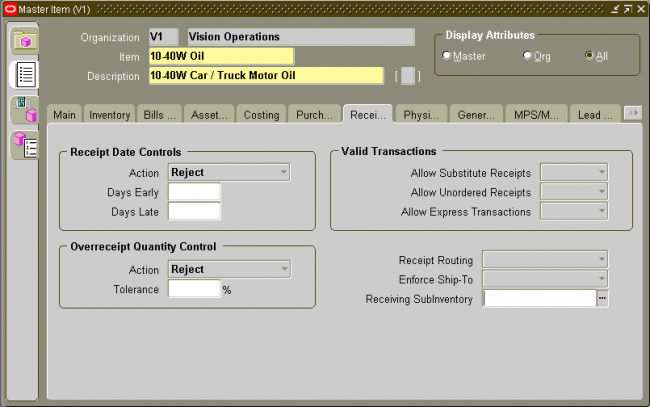
Following are the Receiving attributes and their possible values. You set these attributes when defining or updating items.
Following are the Bills of Material attributes and their possible values. You set these attributes when defining or updating items
BOM Allowed
Allows you to define a bill of material for an item, or to assign the item as a component on a bill.
This attribute is optionally set by the Item Status code.
BOM Item Type
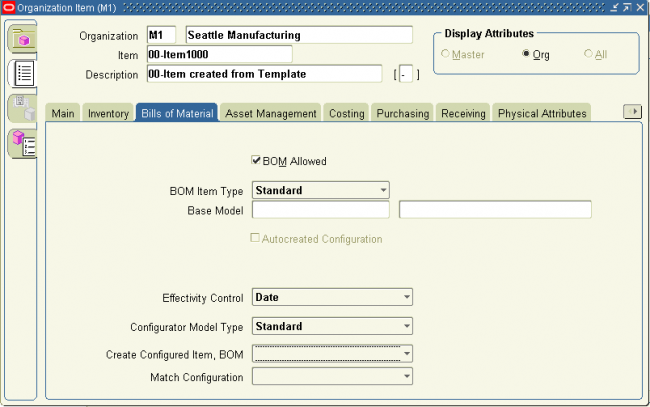 ntrolled at the Master level only.
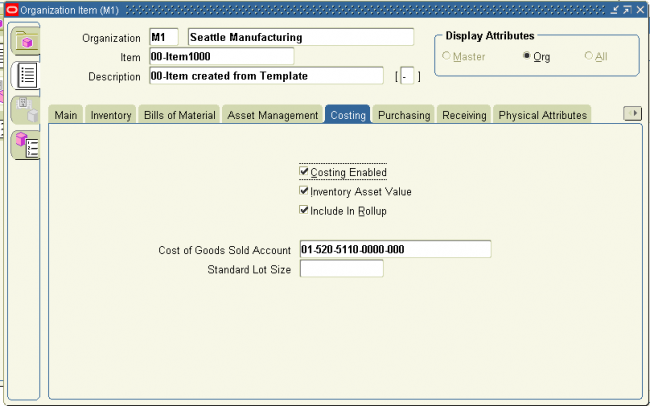
Following are the Costing attributes and their possible values. You set these attributes when defining or updating items.
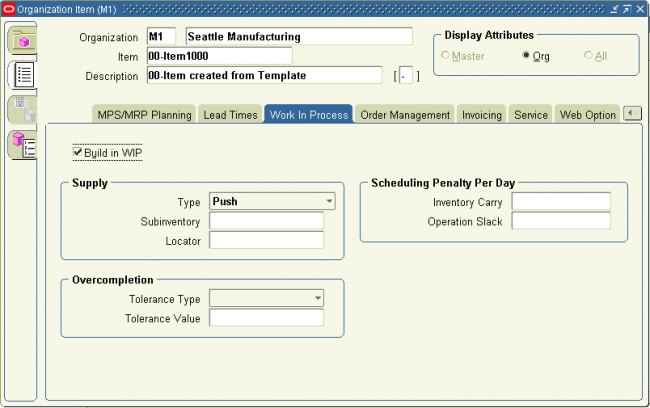
Following are the Work In Process attributes and their possible values. You set these attributes when defining or updating items.
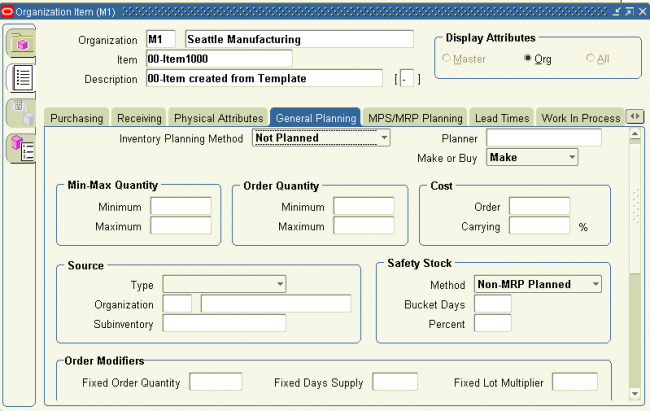
Following are the General Planning attributes and their possible values. You set these attributes when defining or updating items.
Inventory Planning Method
Select an option for organization level planning.
Min–max You define a minimum quantity that you want on hand. When you reach this quantity, you reorder. You also define a maximum on–hand quantity that you do not want to exceed.
Not planned No planning method used. Select this option for MRP/MPS planned items.
Reorder point The reorder point is calculated based on the planning information you define for this item.
Planner
This attribute is controlled at the Organization level only. Enter the material planner assigned to plan this item. You must define planner codes for your organization before updating this attribute. The planner defined here is responsible for approving all move order lines requesting the item if move order approvals are used.
If an item is vendor managed, you must enter a planner for the item.
Make or Buy
Select the option that applies to items with Inventory Item set to Yes. The Planner Workbench uses this to default an appropriate value for implementation type. You cannot change the value of the flag if open orders exist for the item.
Make Usually manufactured. The Planner Workbench defaults the implementation type Discrete job. The planning process passes demand down from manufactured items to lower level components.
Buy Uslly purchased. The Planner Workbench defaults the implementation type to Purchase Requisition. The planning process does not pass demand down from purchased items to lower level components.
Attention: You must also set Purchasable to Yes to create purchase requisitions and purchase orders. If you also set Build in WIP to Yes, you can use the Planner Workbench to implement planned orders as discrete jobs.
Following are the Invoicing attributes and their possible values. You set these attributes when defining or updating items
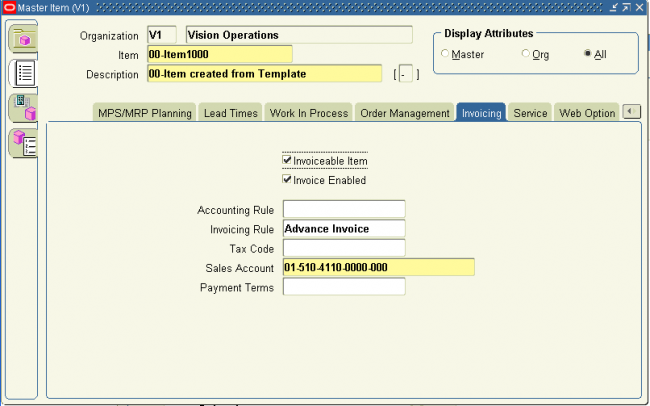
In this chapter we‘ll discuss some advance controls that oracle provides on items
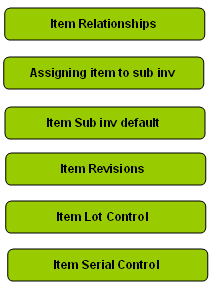
You can define relationships between items. This allows you to search for items through these relationships. Except in Oracle Purchasing, these relationships are for inquiry and reporting purposes only.
Item Relationships with Oracle Purchasing
Within Oracle Purchasing you can define acceptable substitute items for receiving. You must define a list of substitutes before you receive a substitute item in place of an originally ordered item. Attention: If you receive a substitute item, you must have previously defined a unit of measure conversion between the unit of measure on the purchase order and the unit of measure on the receipt.
Cross–Sell: This relationship indicates that one item may be sold in lieu of another item.
Up–Sell: This relationship indicates that a newer version of the item exists, and can be sold in place of the older item.
Service: This relationship establishes service items for a repairable item.
Prerequisite: This relationship indicates that you must possess one of the items as a requirement to possessing the other item.
Collateral: This relationship indicates collateral, such as marketing brochures, that you possess for an item.
Superceded: This relationship indicates that one item has replaced another item that is no longer available.
Complimentary: This relationship indicates if a customer purchases one item, the other item is received for free.
Impact: This relationship is used to relate items to each other but only under special conditions.
Conflict: This relationship indicates that these items may never be used together.
Mandatory Charge: This relationship indcates a mandatory charge if the customer purchases both items.
Optional Charge: This relationship indicates an optional charge if the customer purchases both items.
Promotional Upgrade: This relationship enables a customer to upgrade from one item to another item or equal or higher value, without an additional charge.
Split: This relationship enables you to split support for an item so you do not have to manually split support at contract renewal. To use this relationship, you must be in a planning enabled organization.
Merge: This relationship enables rules based consolidation of contracts. You may use the earliest or latest target end date for consolidation. This allows you to choose how contracts are consolidated. To use this relationship, you must be in a planning enabled organization.
Migration: During contact renewal you are given the option of renewing contracts based on new licenses, or old licenses. To use this relationship, you must be in a planning enabled organization.
Repair to: You use the Repair to item relationship with field service operations that use spares management functionality. If a part has been superseded by another part, the Repair to item relationship determines the replacement part.
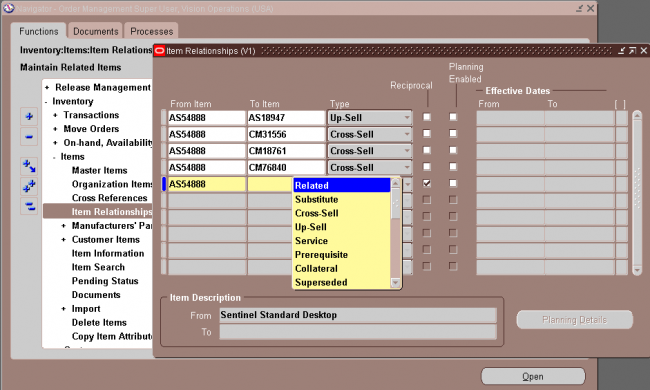
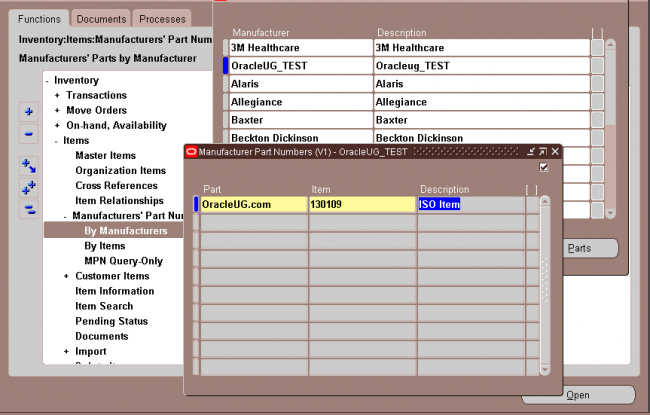
You can define manufacturer part numbers for items. You can use this information for reporting purposes; and in catalog searches for particular items.
Navigate to the Manufacturers window , Enter the name of the manufacturer & Save your work.
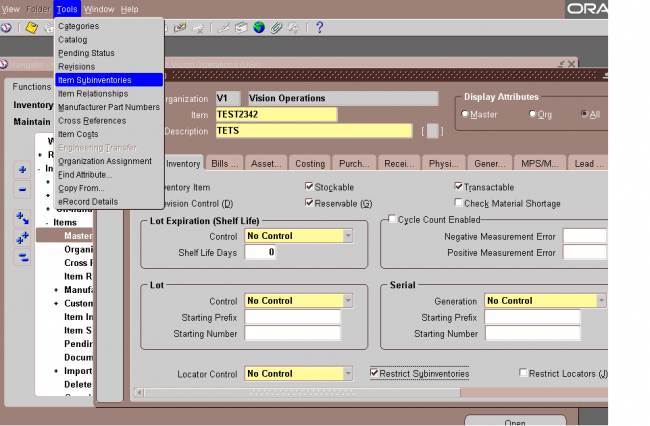
Assigning Subinventories to an Item
You can assign a list of subinventories to an item. You restrict an item to the list of subinventories by setting the Restrict Subinventories attribute when you define or update the item.
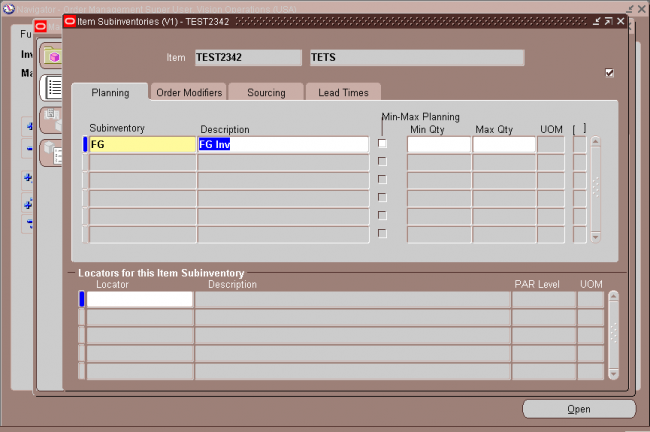
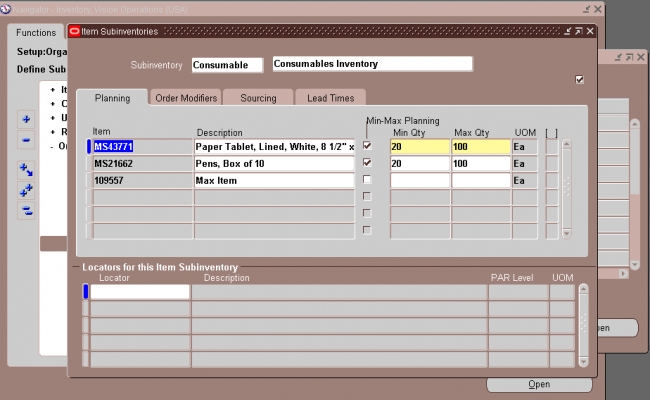
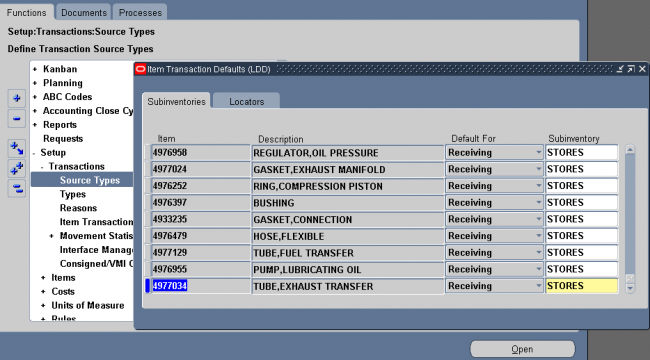
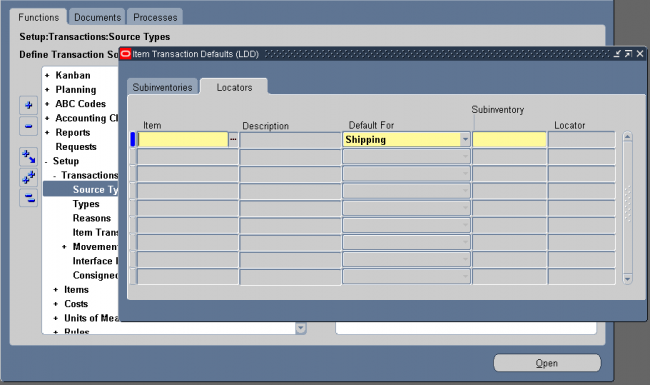
Use this form to define a default subinventory and/or locator for an item for shipping, receiving, and move order transactions. Oracle Shipping Execution displays the default shipping information when you ship an item. Oracle Inventory displays the default receiving information when you receive an item. For move orders, Oracle Inventory derives the default put away locator when you transact an item into a locator controlled subinventory if no locator was specified by the creator of the move order.
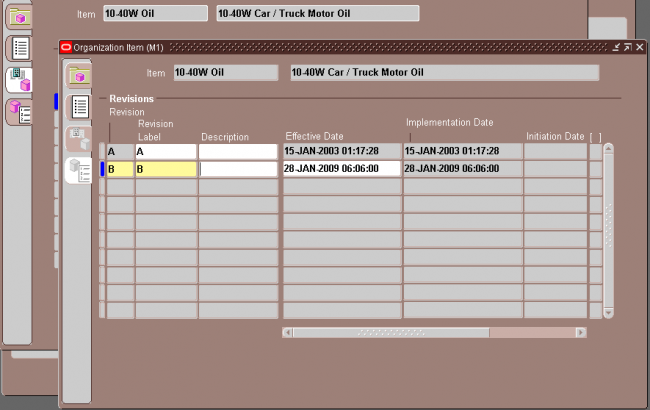
Navigate to the Item Revisions window from one of the following windows:
i.Master Items Summary folder or Master Item window
ii. Organization Items Summary folder or Organization Item window
iii. Bills of Material window
iv. Engineering Change Orders window
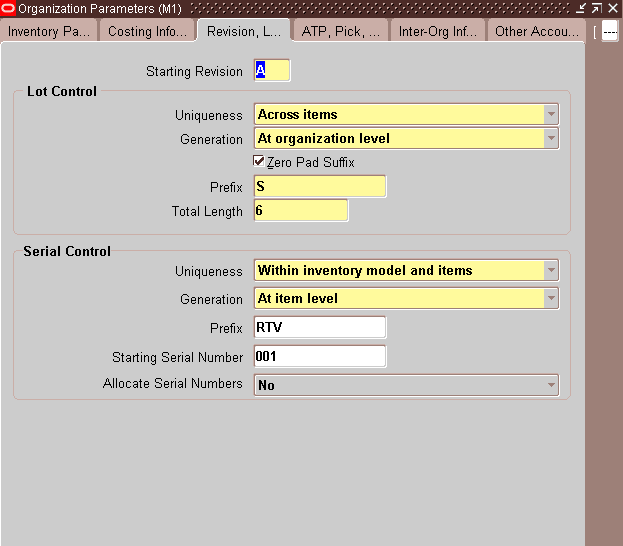
You can use letters, numbers, and characters (such as *, &, and #) to label revisions. Letters are always in upper case and numbers may include decimals. To ensure that revisions sort properly, decimals should always be followed by a number. Valid revisions can include: A, B, 01, 02, A1, B1, 1A, 1B, 0.0, 0.1, A.0, A.1, and so on.
Revisions are sorted according to ASCII rules. Each revision must be greater than the previous revision. Therefore, you cannot use revision 10 after revision 9 because, according to ASCII sorting, 10 precedes 9.
The value you entered in the Starting Revision field in the Organization Parameters window displays as the starting revision for the item. For revisions that have the same effective date, the revisions sort in descending order starting with the last revision you entered.
Oracle Inventory provides complete lot number support for inventory transactions. You can enable lot control for specific items in your inventory. For items under lot control, you assign lot numbers to each receipt into inventory and thereafter reference the same lots each time you perform material transactions. This allows you to have tight control over batches of items in your inventory.
Assigning Lot Numbers
Issuing Material from Inventory
When you issue items under lot control from inventory, you must specify a lot number for that item. You can specify more than one lot to cover the transaction quantity. If you attempt to transact an item to or from an expired lot, Inventory displays a warning message but does not prevent you from using the lot.
Assigning Lot Numbers to Assemblies
When you complete an assembly under lot control into inventory, you must assign a lot number in the WIP Completion Transaction form in Oracle Work in Process. For assembly completions on discrete jobs, Oracle Work in Process defaults the job’s lot number.
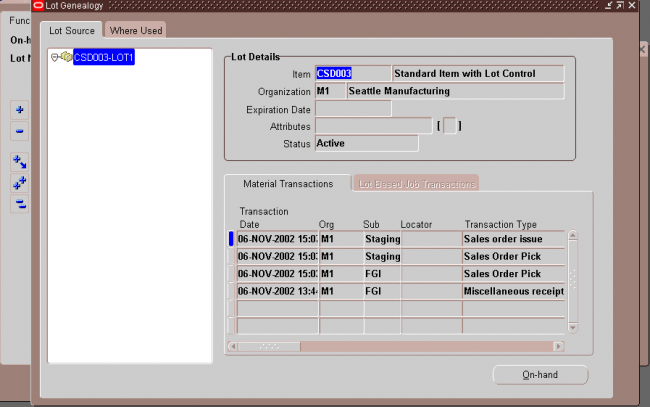
Purging Lot Transactions
You can purge all lot transaction information from your current organization. Note that the transactions must be in closed accounting periods.
Attention: Purging lot transactions eliminates information used in lot genealogy reports and inquiries (Supplier Lot Trace Report, Job Lot Composition Report, and Job Lot Composition Inquiry).
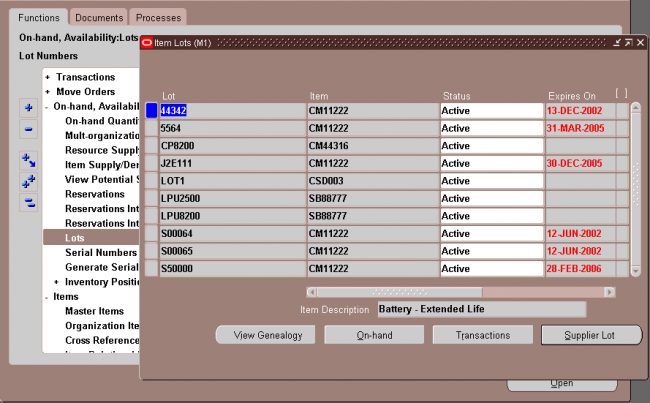
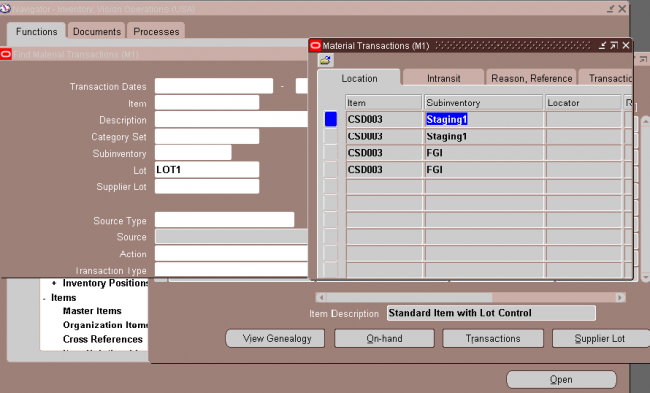
Maintaining Lot Number Information
You can use the Item Lots window to update the expiration date of lots for items under lot expiration (shelf–life) control. Inventory lets you view all lots you created in your current organization and the supplier lot information associated with them.
Expired Lots
You can determine whether a lot has an expiration date by assigning a number of lot control shelf life days or by entering an lot expiration date. The expiration date controls the availability of the lot for transacting and planning purposes. An expired lot:
• is not considered as on–hand supply when performing min–max, reorder point or MRP planning calculations
• cannot be reserved for a date beyond the expiration date
• can be transacted and is included in on–hand quantities
• is included in all inquiries and reports, including inventory valuation reports
• is included in a cycle count and count entry and adjustments are allowed
• is included in a physical inventory and tag entry and adjustments are allowed
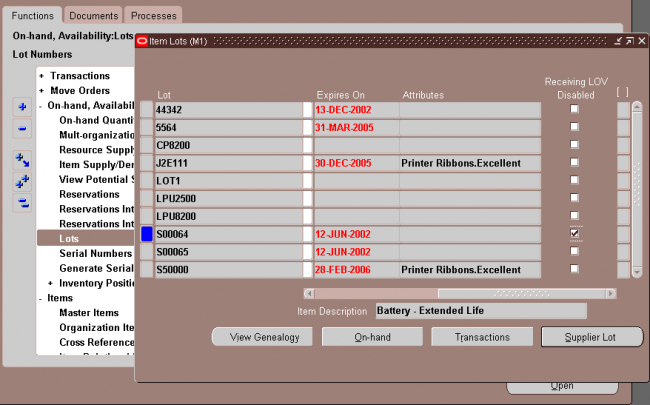
Disabled Lots
Disabling a lot only prevents it from appearing in a list of values when performing receipt transactions. If you type in the lot number it is valid and acccepted even though it was not in the list of values. Disabling is used only for tailoring this specific instance of the list of values for lot numbers. A disabled lot:
• is included in available to transact, available to promise, and available to reserve calculations
• is included as on–hand supply when performing min–max, reorder point or MRP planning calculations
• is included as on–hand in all inquiries and reports, including inventory valuation reports
• can be transacted with Inventory functions and the Transaction Open Interface
• can be reserved

Cycle Counting
Inventory includes the lot numbers of the items to cycle count when it generates a cycle count listing. You must assign lot numbers to all items under lot control for which you enter counts. If there is a difference between the count quantity and the system on–hand
quantity, Inventory adjusts the item quantity in that lot.
Performing Physical Inventories
Inventory includes the lot numbers of the items to count in your physical inventory when it generates tags. You must assign lot numbers to all items under lot control for which you enter counts in the Physical Inventory Tag Counts window. If there is a difference between the count quantity and the system on–hand quantity, Inventory adjusts the item quantity in that lot.
Before using the lot control we need to have the following 3 setups
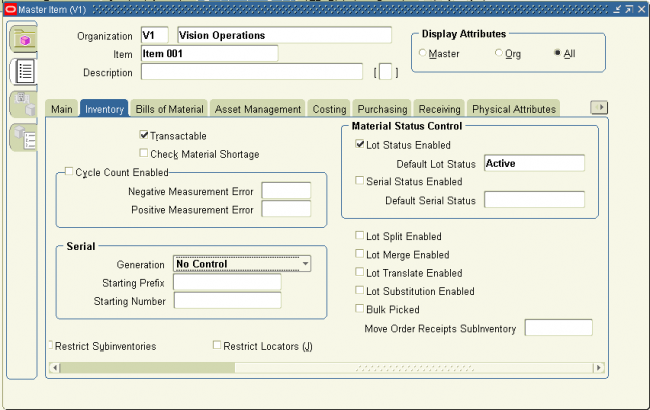
1. Lot information in inventory tab of item master
http://www.oracleug.com/user-guide/oracle-inventory/inventory-attribute-group


3. Use the Work in Process Parameters window to set up lot control in Oracle Work in Process. You choose the option by which Oracle Work in Process defaults and verifies lot numbers during backflush transactions. You also specify the method by which Oracle Work in Process defaults lot numbers on discrete jobs for lot controlled assemblies.
You can update the disable status and expiration date associated with item lot information.
Oracle Inventory provides complete serial number support for inventory transactions. You can enable serial number control for specific items in your inventory. For items under serial number control, you assign unique serial numbers to individual units and
thereafter reference the same serial numbers each time you perform material transactions. This allows you to have tight control over every unit of every item in your inventory. If your item is under dynamic entry At sales order issue, you can only assign serial numbers when you perform a shipment transaction in Oracle Shipping Execution.
Serial Number Validation
Oracle Inventory enables you to perform two optional validations for serial numbers that have been used in Oracle Work in Process. This validation is enabled by setting the profile option, Inventory: Restrict Receipt of Serials to Yes.
• Validation of serialized components:
Enabling the profile option will validate that a given serial number for an item may not be received via purchase order receipt, miscellaneous receipt, or account alias receipt, if that same serial number has been issued to Oracle Work In Process.
• Validation of serialized end–assemblies:
Enabling the profile option will validate that a given serial number for an end assembly item may not be completed into Oracle Inventory for a Discrete Job, Repetitive Schedule, Flow Schedule, and Work Order–less Completion, if that same serial number has a state of, Issued out of stores.
Issuing Material from Inventory
If you issue items with a serial number control type of dynamic entry At inventory receipt or Predefined, you must choose from the list of serialized units that you have already received into inventory. If you issue items with a serial number control type of dynamic entry At sales order issue, you must assign serial numbers when you ship the item
against a sales order.
Assigning Serial Numbers to Assemblies
When you receive into inventory a completed assembly with a serial number control type of dynamic entry At inventory receipt or Predefined, you must assign a serial number in the WIP Completion Transaction window in Oracle Work in Process. You either accept the default serial number or enter another valid one.
Returning Serialized Units to Suppliers
You can return serialized units to the supplier in the Enter Returns and Adjustments window. Oracle Inventory updates the serial number information with the purchase order number and transaction date of the return so that the location of the serialized unit is known.
When you receive replacement units, you can issue new serial numbers. When you receive repaired units, you should reference the original serial numbers so that Oracle Inventory can properly update the existing serial numbers
1. Item master setup
http://www.oracleug.com/user-guide/oracle-inventory/inventory-attribute-group

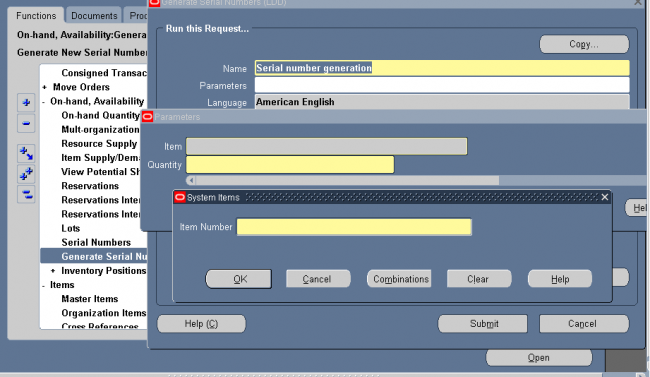
Generating Serial Numbers
If you specified Predefined as the serial number control type for an item, you must predefine serial numbers for that item.
If you specified entry At inventory receipt or At sales order issue, you can optionally predefine serial numbers for the item. The process of generating serial numbers does not assign serial numbers to units in inventory, it simply reserves specific serial numbers for an item, for later use. When you run the serial generation program if you have the same serial prefix number across organizations, the concurrent program searches across the organizations, and generates serial numbers using the highest start number across the organizations.
Serial Number Assignment
You must assign serial numbers whenever you receive items under serial number control into inventory. If an item is under Predefined control, you can choose from the list of predefined serial numbers for that item. If an item is under dynamic entry At inventory receipt, you can choose from a predefined list of serial numbers or enter any serial number, depending on the uniqueness control for your organization. You can create and assign serial numbers individually or as a range to speed up data entry. If your item is under dynamic entry At sales order issue, you can only assign serial numbers when you perform a shipment transaction in Oracle Shipping Execution.
Once you assign a serial number to an item, the combination of the serial number and the item is an entity known as a serialized unit. From that point on, Oracle Inventory tracks all movements and maintains the following information for each serialized unit:
• Receipt or Ship Date
The date on which you last performed a material transaction for your serialized unit. Material transactions update this
information when you move your serialized unit.
• Serial State
Oracle Inventory assigns one of the following states to your serialized unit: Defined but not used, Resides in inventory, Issued out of inventory, or Resides in intransit.
Status Codes
---------------------
1 Defined but not used
3 Resides in stores
4 Issued out of stores
5 Resides in intransit
6 Pending status
7 Resides in receiving
8 Resides in WIP
You can get a full list of the codes with the following SQL: select
lookup_type,
lookup_code,
meaning
from mfg_lookups
where lookup_type = 'SERIAL_NUM_STATUS'
order by lookup_type, lookup_code
• Location
The organization, subinventory, and locator in which the serialized unit currently resides. Material transactions update
this information when you transfer the serialized unit.
• Revision level
The revision of the item when you assign the serial number to the unit.
• Lot number
During material transactions, you first specify the lot number and then the serial number. Oracle Inventory tracks the lot from which a specific serialized unit originates.
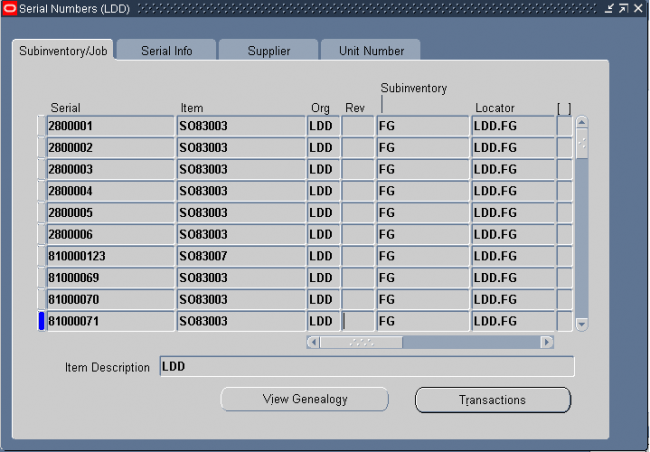
You can view location, job and state information, as well as update supplier information associated with your serialized units.
1. Navigate to the Serial Numbers window. The Find Serials window appears.
2. Enter search criteria. If you do not enter criteria, a query for all serial numbers is performed.
3. Choose the Find button to display the serial number and item information in the Serial Numbers window.
You must set certain controls and options before performing inventory transactions. These include:
Setting transaction profile options:
Oracle Inventory provides you with the following transaction processing profiles:
• Enter Replenishment Count
• Inter–Organization Transfer
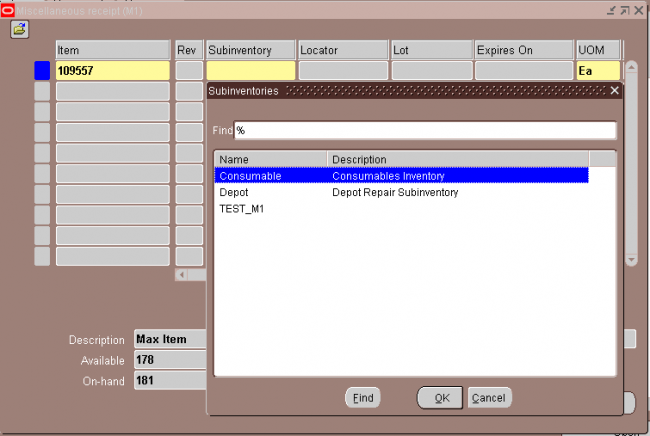
• Miscellaneous Issue and Receipt
• Transaction Processing Mode
• Transfer Between Subinventories
• Update Average Cost
• Server Side On–line Processing
• Allow Expense to Asset Transfer
• Project Miscellaneous Transaction Expenditure Type
• RPC Timeout
• Restrict Receipt of Serials
• Transaction Date Validation
• Use New Trx Manager for Processing
• Override negative for Blackflush
• Quantity Tree Timeout for Lock
• Maximum Number of Quantity Trees
• Cycle Count Approvals
• Cycle Count Entries
Transaction Processing Mode
You can set processing control globally for all transactions or you can choose different options for each type of transaction. You establish the method of transaction processing by choosing one of the following options when you set up your TP:INV Transaction Processing Mode profile:
On–line processing Processes transactions while you wait and returns control to you once it finishes.
Background processing Returns control immediately to you. With this option, Oracle Inventory processes transactions
on a periodic basis via the Inventory Transaction Manager.
Immediate concurrent processing Spawns a concurrent process when you commit the transaction and returns control immediately to you, allowing you to continue working.
Form level processing Processes transactions using the processing control option you choose for that particular type of transaction. You must also set the Inventory profile options for Inter–Organization Transfer, Miscellaneous Issue and Receipt,
Receive Customer Return, Return to Customer, and Transfer Between Subinventories. If you are using Oracle Work–in–Process, you must set the WIP profile options Completion Material Processing, Completion Transaction Form, Material Transaction Form, Move Transaction, Operation Backflush Setup, and Shop Floor Processing.
If you choose Form level processing for the Transaction Processing Mode profile you can set up different processing controls for each type of transaction.
On–line Processing If you use On–line processing, you can choose whether transactions are processed on the server or client side by setting the Server Side On–line Processing profile. The default value is server side processing.
Inventory Remote Procedure Manager Server side on–line processing uses the Inventory Remote Procedure Manager to allow a transaction initiated on the client to process on the server. System managers maintain the Remote Procedure Manager.
Launching Transaction Managers
The transaction managers execute the following processes:
material transaction,
move transaction,
resource cost transaction,
material cost transaction,
demand reservation &
remote procedure call.
These run at periodic intervals you specify until you delete them with the concurrent manager. They control the number of transaction workers, processing intervals, and number of transactions processed by each worker during each interval.
The relationship between transaction source type, transaction action and transaction type is shown in below picture.
![]()
Transaction source type = Purchase Order
Transaction source = Purchase Order Number
Transaction Action = Receipt
Transaction type = PO Receipt
A transaction action is a generic type of material movement or cost update with no specificity regarding the source of the transaction. Along with a transaction source type, a transaction action identifies a transaction type. Oracle Inventory provides the following transaction actions:
• Issue from stores
• Subinventory transfer
• Direct organization transfer
• Cycle count adjustment
• Physical inventory adjustment
• Intransit receipt
• Intransit shipment
• Cost update
• Receipt into stores
• Delivery adjustments
• WIP assembly scrap
• Assembly completion
• Assembly return
• Negative component issue
• Negative component return
• Staging Transfer
A transaction type is the combination of a transaction source type and a transaction action. It is used to classify a particular transaction for reporting and querying purposes. Oracle Inventory also uses transaction types to identify certain transactions to include in historical usage calculations for ABC analysis or forecasting. The following table presents predefined transaction types:
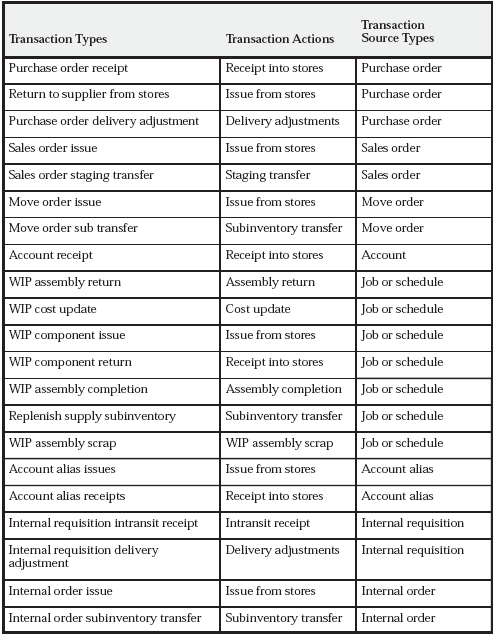
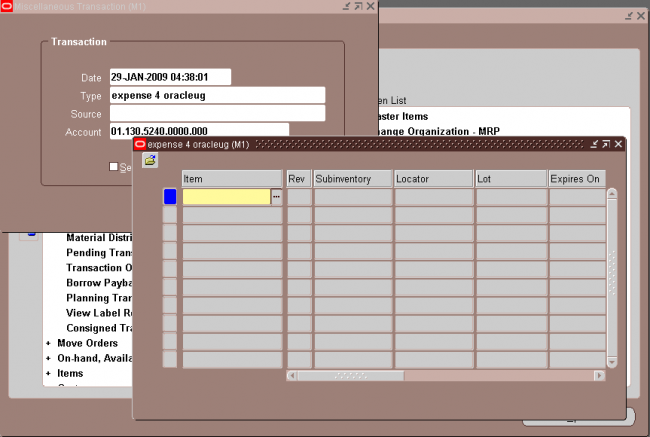
Use the Transaction Types window to define additional transaction types to customize transaction entry. A user–defined transaction type is a combination of a user–defined transaction source type and a predefined transaction action. For example, if you frequently donate items to charity, you might want to define a transaction source type called ”Charity” and a transaction type called ”Issue to Charity”. In this case, the transaction action would be Issue from Stores. You would then use the Miscellaneous Transactions window to actually issue an item to charity, using the ”Issue to Charity” transaction type. You would also specify the actual charity to which you are issuing, such as Goodwill, and the expense account that specifies the source (Goodwill).
You define transaction types by combining transaction actions and transaction source types. You define transaction source types in the Transaction Source Types window. Oracle Inventory provides the list of transaction actions.
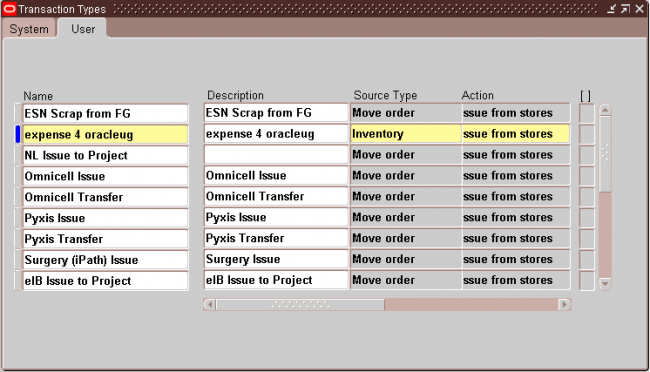
You must specify a transaction type when you perform a miscellaneous receipt or issue, a subinventory transfer, a WIP transaction, or an inter–organization transfer.
A transaction reason is a standard means of classifying or explaining the reason for a transaction. Transaction reasons can be used in all transaction forms.
You can use these standard transaction reasons with any type of material transaction. Oracle Inventory provides transaction reporting and inquiring capabilities by transaction reason.

In the reason type from the list of values. The available choices are as follows:
• Load
• Drop
• Receiving
• Replenishment
• Cycle Count
• Shipping
• Update Status
• QA Update Status
Note: The Replenishment reason type is disabled.
If you selected Picking as the Reason Type, select a Reason Context from the list of values. The available choices are as follows:
• Curtail Pick: End the pick after picking a few LPNs or Lots and load the contents.
• LPN Exception: Pick partial quantity of the scanned fully consumable LPN.
• Pick None: End the pick without picking anything.
• Pick Over: Pick more than the requested quantity.
• Pick Partial: Split the pick and allow confirmation of less than the requested quantity. You must still pick the entire quantity, but can pick in stages.
• Pick Short: Specify a quantity less than the requested quantity, and back order the rest of the required quantity.
• Change Source Locator: Change the location from which the material is picked.
• Change UOM: Change the transaction unit of measure for the task.
Use the Inter–Organization Shipping Network window to define accounting information and the relationships that exist between shipping and destination organizations. You can specify whether an organization is a shipping organization, a destination organization, or both.
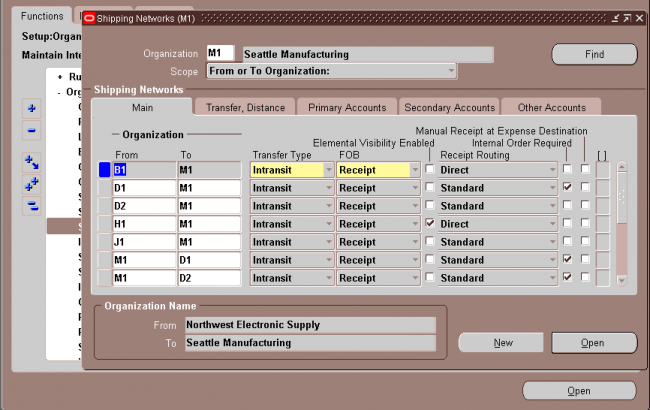
1. From-TO organization

8. Intransit lead time
Select Shipping Methods on the Tools menu to open the Inter–org Shipping Methods window.
Enter the shipping method for which you want to associate an intransit lead time for the displayed from and to organizations and enter the intransit lead time in days.
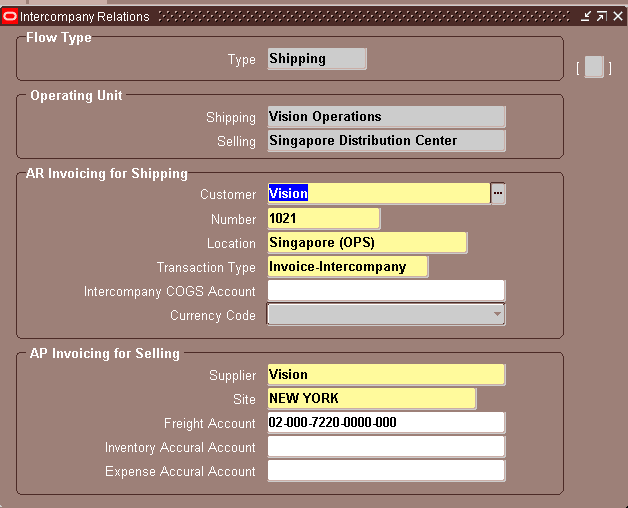
Use the Intercompany Relations window to define, query, and update intercompany relations between two operating units in a multi–organization environment. These operating units are either the shipping organization and the selling organization, or the receiving and purchasing organization.
When a sales order is entered in an operating unit, the shipping organization is often part of a separate operating unit, belonging to a separate set of books. Once the sales order is shipped to the customer, the inventory asset account for the shipping organization is credited and the cost of goods sold account is debited. On the other hand, sales revenue must be recognized in the order entry organization. If the two organizations belong to different operating units, the system must perform accounting distributions to record the intercompany revenue, receivable, and payable entries.
Oracle Inventory and Oracle Receivables must be installed before you can define intercompany relations. If Oracle Payables is not installed, the fields in the AP Invoicing for Selling region are not required.

Oracle Inventory, with Oracle Order Management, Oracle Purchasing, and Oracle Work in Process, provides you with a complete set of transactions and reports for maintaining inventory control. This allows you to control the flow of material from the time you receive items to the time you ship finished goods to the customer.
Inventory transactions and on hand balance supports decimal precision to 5 digits after the decimal point. Oracle Work in Process supports decimal precision to 6 digits. Other Oracle Applications support different decimal precision. As a result of the decimal precision mismatch, transactions another Oracle Application passes may be rounded when processed by Inventory. If the transaction quantity is rounded to zero, Inventory does not process the transaction. It is therefore suggested that the base unit of measure for an item is set up such that transaction quantities in the base unit of measure not require greater than 5 digits of decimal precision.
You can define multiple inventories, warehouses, and manufacturing facilities as distinct organizations. With Oracle Inventory you can perform inter–organization transfers as direct or intransit shipments.
Inter-Org transfers can be done within or accross operating units but you can not generate intercompany invoice with inter-org transfer. Intercompany invoicing is possible for inter-org transfers of type ‘In-transit’ only through ‘Internal sales Orders’. No intercompany invoicing is possible if you perform org transfers between two inventory orgs belonging two different operating units without ‘internal sales Orders’. Also note that intercompany invoice cannot be raised for inter-org transfers of type ‘Direct Transfer’ through Internal sales Orders.
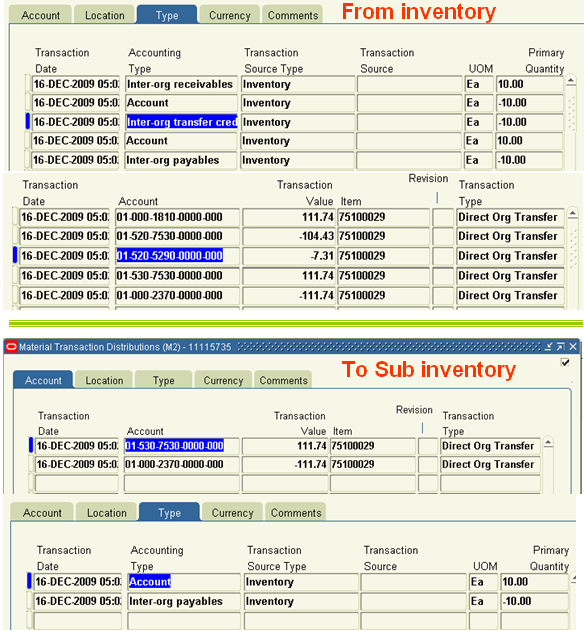
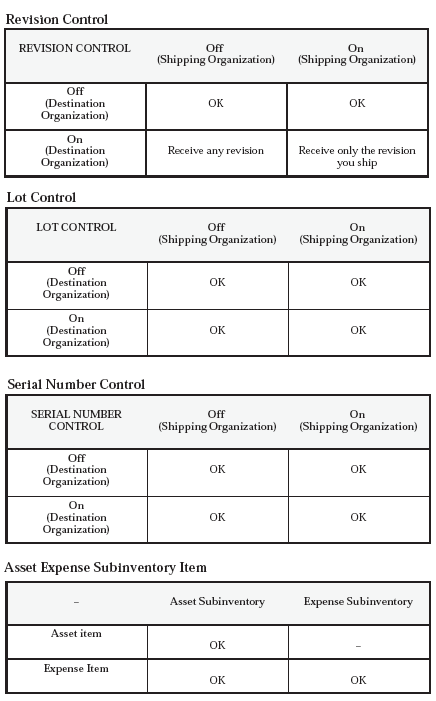
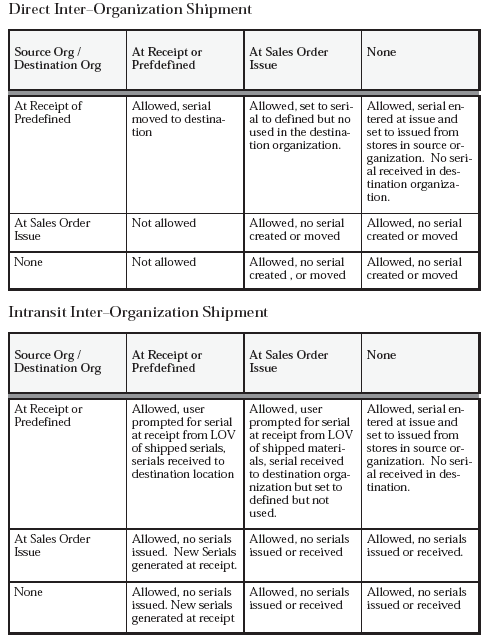
You can use a direct inter–organization transfer to move inventory directly from a shipping organization to a destination organization. The validity of a transfer transaction depends on the controls you have defined in both the shipping and destination organizations for the items you want to transfer. For example, you can transfer item A from organization X to organization Y, even though item A is under lot control only in organization X (you can specify the lot numbers for item A in organization X during the transfer transaction). However, you cannot transfer item B from organization X to organization Y if item B is under lot control only in organization Y (you cannot specify lot numbers for item B in the destination organization because you are performing a
direct transfer).
The following tables present direct, inter–organization transfers.(As given in oracle user guide)

If destination is Asset/Serial controlled/Lot controlled/ Revision Controlled then the source needs to be Asset/Serial controlled/Lot controlled/ Revision Controlled
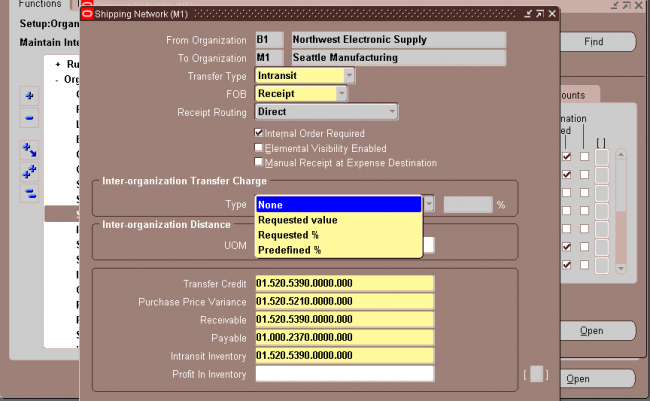
You usually transfer material to intransit inventory when transportation time is significant. When you perform the transfer transaction, you do not need to specify the delivery location. You only need to enter the subinventory you are shipping from, a shipment number, the freight information, and, depending on the inter–organization transfer charge that applies between the organizations, a percentage of the transaction value or a discrete amount that Oracle Inventory uses to compute transfer charges.
If the FOB point is set to Receipt in the Shipping Networks window, the destination organization owns the shipment when they receive it. If it is set to Shipment, the destination organization owns the shipment when the shipping organization ships it, and while it is intransit.
While your shipment is intransit, you can update shipping information such as the freight carrier or arrival date in the Maintain Shipments window.
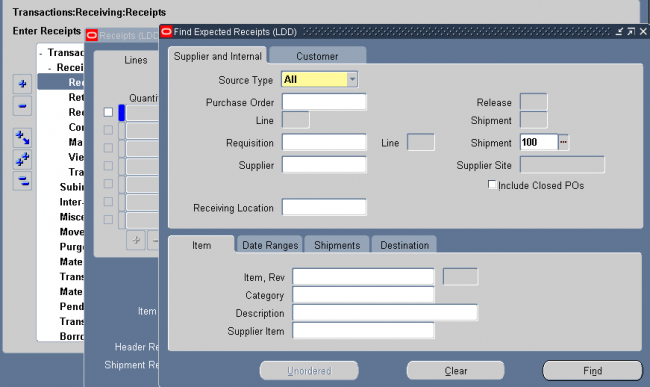
At the time of shipment, you must define your receiving parameters for the destination organization. You can receive and deliver your shipment in a single transaction or you can receive and store your shipment at the receiving dock.
The validity of a transfer transaction depends on the controls you have defined in both the shipping and destination organizations for the items you want to transfer. For example, you can transfer item A from organization X to organization Y, even though item A is under lot control only in organization X (you can specify the lot numbers for item A in organization X during the transfer transaction). You can also transfer item B from organization X to organization Y if item B is under lot control only in organization Y (you can specify lot numbers for item B in the destination organization when you perform the receiving transaction).
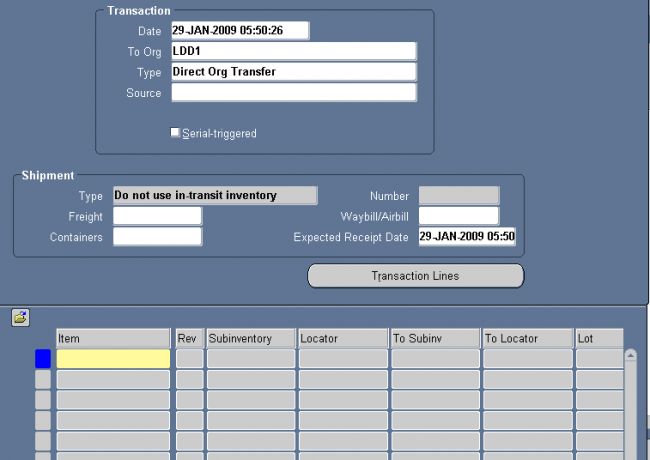
1. The following tables present inter–organization transfers via intransit inventory.
2. In case of inter organization transfer via Intransit we required to put the shipment number
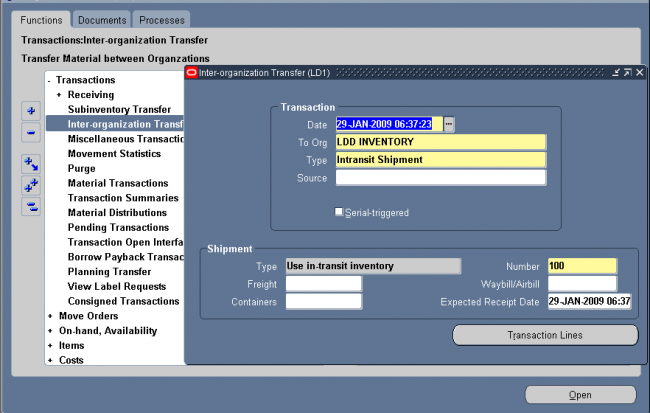
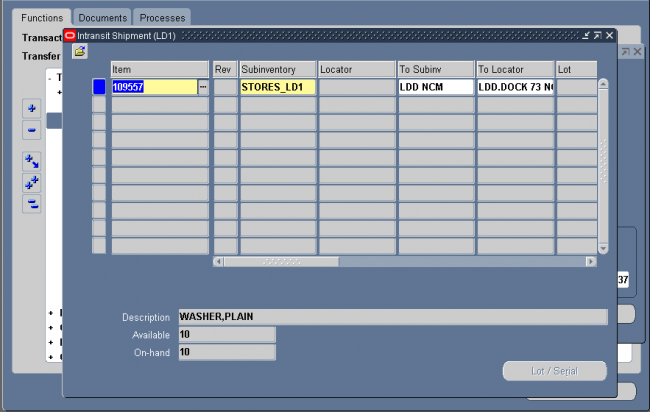
After completing the inter org transfer, go to the receiving form of the 'to org' and receive the shipment with the shipment number.
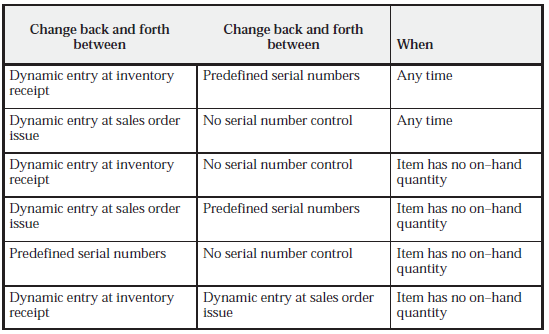
There are certain restrictions and expected behaviors when transferring items between organizations where the serial control in the source and destination organizations are different. The following tables explain the expected results.
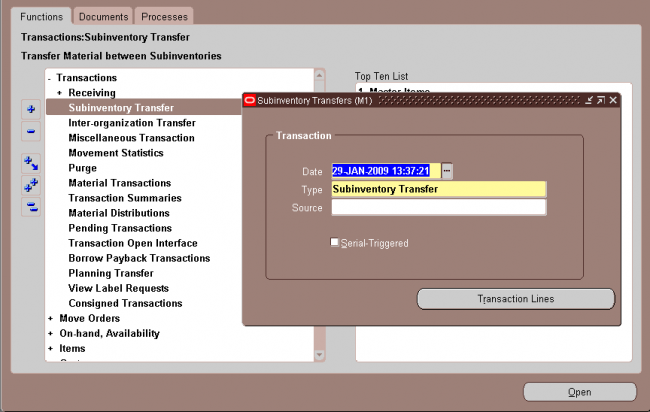
You can transfer material within your current organization between subinventories, or between two locators within the same subinventory. You can transfer from asset to expense subinventories, as well as from tracked to non–tracked subinventories. If an item has a restricted list of subinventories, you can only transfer material from and to subinventories in that list. Oracle Inventory allows you to use user–defined transaction types when performing a subinventory transfer.

To do a subinventory transfer from expense to asset subinventory set the profile option INV: Allow Expense to Asset Transfer to "Yes."
If it has not been set it to "Yes," it is possible to issue from an asset to an expense subinventory, but issue from an expense to asset subinventory is not possible. Oracle Inventory expects the consumption of material at the expense location. If you return an asset item to an expense subinventory, you must be first issue it from the expense subinventory using the Miscellaneous
Transaction form and transfer it to the subinventory expense account. Then, no accounting occurs and you only transfer quantities. To receive the asset item back to the asset subinventory, perform the Miscellaneous Transaction account receipt using the same expense account as the expense subinventory.
For receiving an ASSET item back, you use the Miscellaneous Transaction instead of the subinventory transfer.
With a miscellaneous transaction you can issue material to or receive material from general ledger accounts in your current organization. This allows you to issue material to groups that are not inventory, receiving, or work in process such as a research and development group or an accounting department. You can also make manual adjustments to the general ledger by receiving material from one account to inventory, and then issuing that material from inventory to another account.
You can use your user–defined transaction types and sources to further classify and name your transactions. You can use this feature to issue items to individuals, departments, or projects; or to issue damaged items to expense accounts such as scrap. You can perform the receipts for items that were acquired by means other than a purchase order from a supplier. You can also use this feature to load all item on–hand quantities when you start implementing Oracle Inventory.
You will receive a material shortage alert while performing a miscellaneous transaction if you have enabled shortage alerts for the miscellaneous transaction type being performed. Also, a miscellaneous transaction can trigger a shortage notification to be sent to various pre–defined individuals.
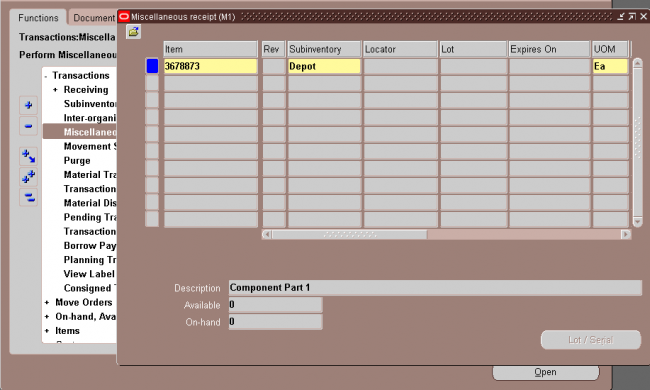
Oracle Inventory provides a variety of windows to view
You use the material workbench to view on–hand quantities. The Material Workbench enables you to view on–hand balances for inventory items by

• Location: Location information includes the subinventory and associated locators. You can also view subinventory quantities, including the packed and unpacked quantities.
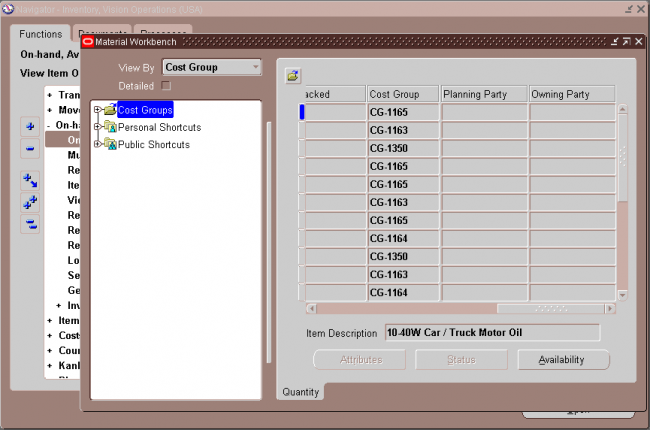
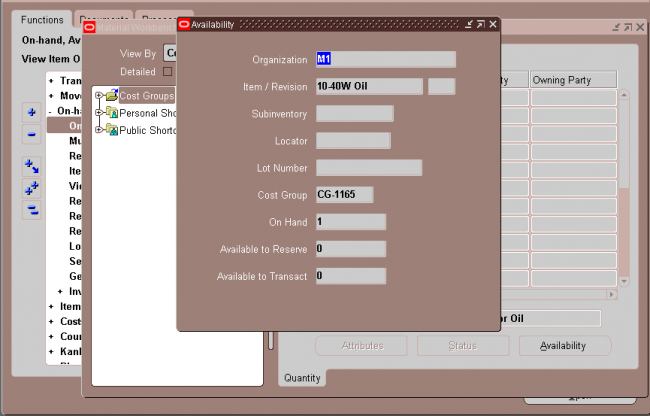
You can view the following information in the effective status window.
• Subinventory Status: The subinventory status.
• Locator Status: The locator status. This field is blank if the item is not locator controlled.
• Lot Status: The lot status. This field is blank if the item is not lot controlled.
• Serial Status: The serial status. This field is blank if the item is not serial controlled.
• Transaction Types: The transaction types alternative region displays the allowed and disallowed transaction types for the
item.
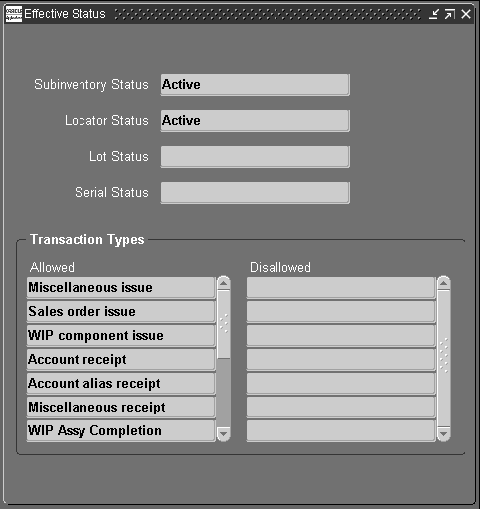
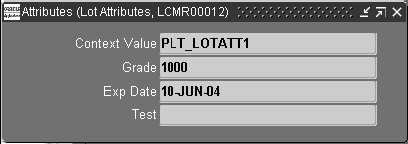
5. Material Workbench Transactions
You can use the Material Workbench tools menu to perform the following transactions:
• Mass Move: Moves the selected items to a new subinventory.
• Mass Issue: Enabled you to mass issue an item.
• Status Update: Enables you to change status information.
• Cost Group Transfer: Enables you to transfer the item to another cost group.
• Cycle Counting: Enables you to initiate a cycle count for the selected subinventory.
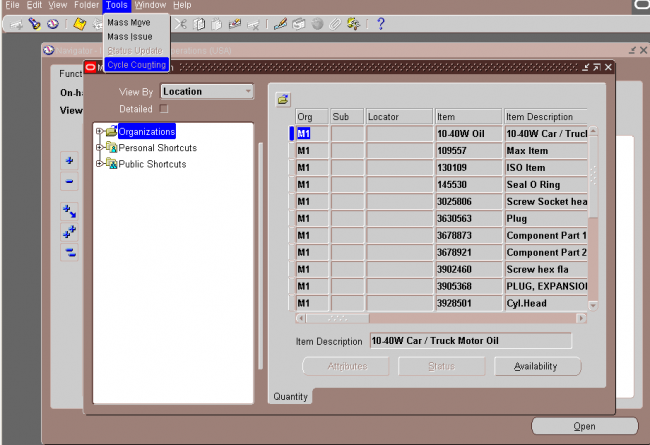
Use the Multiple Organization Inventory Report to show the inventory quantity on hand for items in more than one organization. The report has no limitations on the number of organizations you can enter. The report is sorted by inventory item for all of the organizations. You can include quantities that are in transit. If you have revision control items, you can report on the revision quantities individually (for each revision) or summed for the item. You can run the report for all items, or you can specify a range of items.
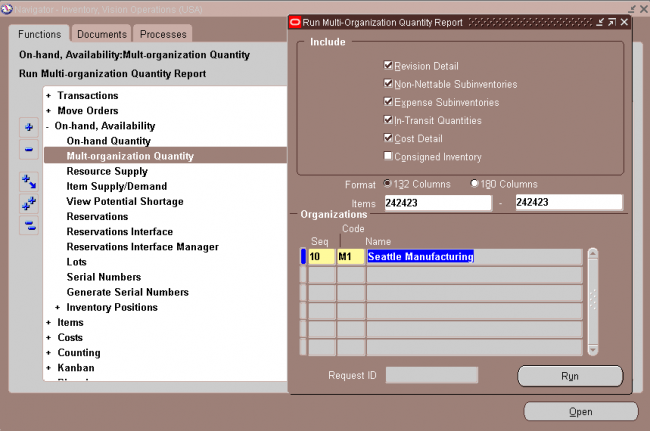
You can view supply/demand information, and the current and projected available quantities of an item.
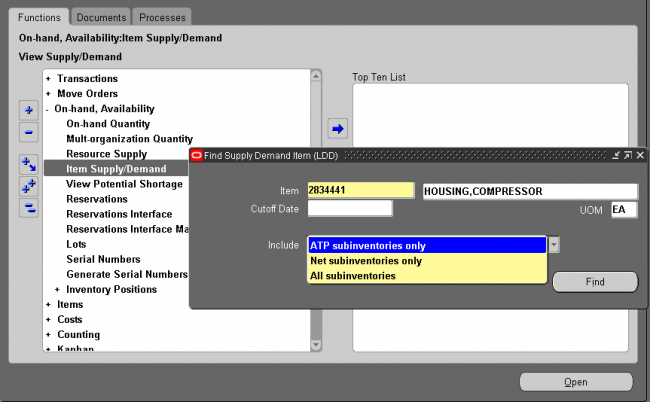
Supply/Demand Type: The supply source or demand source type, such as Account number, Purchase order, Sales order, and WIP discrete job.
Identifier: The identifier for the supply source or demand source, such as the purchase order number or work in process discrete job number.
Quantity: The scheduled supply quantity or demand quantity for the item. Demand quantities are displayed as negative numbers. Supply quantities are displayed as positive numbers.
Available Quantity: The projected on–hand quantity of the item, defined as Current Available plus all future sources of supply and less all future sources of demand
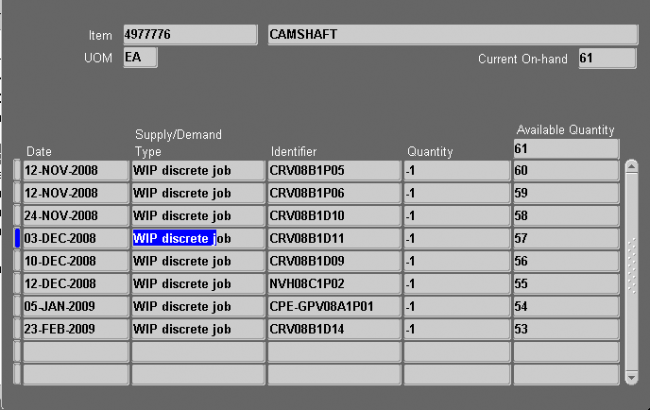
Calculating the Available to Promise (ATP) is a method of checking the projected supply of an item at a given time.
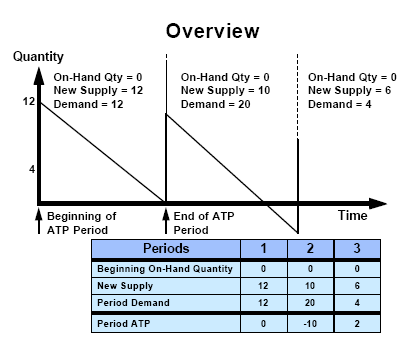
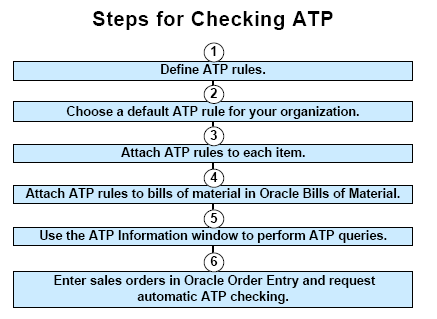
To implement available to promise, you begin by defining your ATP rules. ATP rules let you tailor the ATP calculation to suit your business needs. Each rule is a combination of ATP computation options, time fence options, and supply and demand sources to use during an ATP inquiry. You cannot delete an ATP rule, but you can rename or redefine existing rules by updating fields.
You can define multiple ATP rules to reflect th
e specific needs of your organization, and then use different rules to calculate availability for different items or groups of items. Each time you run an ATP check, the rule determines how existing supply and demand are matched. You can choose one of the ATP rules you define as the default ATP rule for your organization. You can update the item attribute ATP Rule to specify a default ATP rule for each item.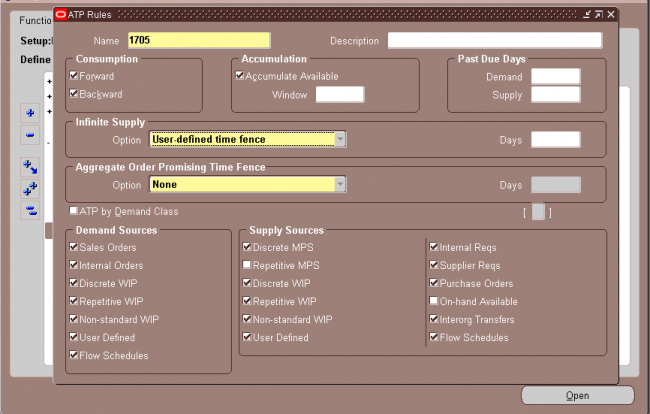
ATP Computation Options
You can choose a variety of computation options to suit your business needs. ATP computations use the consumption and accumulate available features. Consumption resolves negative ATP after it is already determined that there is not enough available inventory.
Accumulation uses excess inventory from a period to determine where new demand can be placed. You can choose any combination of the following options:
Backward consumption only
ATP calculates availability for your item period by period. If the available supply quantity for the period does not meet the existing demand for that period, ATP works backward, period by period, and checks if the available supply within each period is sufficient to meet the excess demand. ATP does not combine the available quantities from multiple periods to meet an existing demand.
Backward consumption and accumulate available
ATP accumulates the excess supply from period to period. When demand in a period exceeds supply, this accumulated quantity is dipped into and reduced. When you perform an availability check, the accumulated quantity is available for your demand.
Forward consumption and backward consumption
ATP consumes backwards first. If the available supply quantity for a period is not enough to meet the period’s demand, ATP
steps back period by period to try to satisfy demand. If the demand cannot be met, ATP then moves forward into future periods to check on available supply.
Keep in mind that the ATP rule applies to existing demand and supply, and determines the quantity available on a period by period basis. Your quantity check is done against the results. ATP does not try to forward consume or backward consume your ATP check quantity.
ATP Time Fence Options
You can specify time fences for your ATP rules to restrict the use of both supply and demand. Time fences help you filter the noise out of the ATP calculation. You can implement the following time fence options:
Past Due Demand Days
ATP does not include any demand orders with a due date before this time fence. ATP uses the number of manufacturing workdays you enter for this fence to back off from the current system date and determine the past due time fence.
Use this time fence if you have sales orders, jobs, repetitive schedules, or other demand outstanding with past due dates that you do not plan to fill from existing or planned supply. If the due dates are before the time fence, ATP does not include these orders as demand.
Past Due Supply Days
ATP does not include any supply orders with a due date before this time fence. ATP uses the number of manufacturing workdays you enter for this fence to back off from the current system date and determine the past due supply fence.
Use this time fence if you have purchase orders, jobs, repetitive schedules or other supply orders with past due dates that you do not want to rely on as a source of supply for your ATP calculations. If the due dates are before the time fence, ATP does not include these orders as supply.
Infinite Supply Time Fence
Use this time fence to specify the end of your ATP horizon. ATP considers any demand that falls beyond this time fence as available. Use this time fence as the practical lead time you need to acquire components and build any quantity that a customer may order. You can choose from the following options to determine the infinite supply time fence:
• Cumulative manufacturing lead time
• Cumulative total lead time
• Item total lead time (does not include lead time of components)
• User–defined time fence (specify the number of supply days for your rule)
Accumulation Window
If you choose to accumulate expected surplus in one ATP period to the next, you can limit this accumulation to a specific number of workdays. Oracle Inventory does not treat excess supply as available supply beyond this accumulation window. Oracle Inventory also uses this option in backward consumption calculations, preventing excess supply from a period beyond the accumulation window from covering a shortage in a future period.
You can use the accumulation window to prevent the commitment of supply to satisfy demand with requirement dates far into the future. This is particularly useful if you have an item with high turnover and would likely be able to sell it quickly.
ATP Supply Source Options
You can choose the supply sources for each ATP rule. The ATP rule you use during the ATP inquiry then determines which sources of supply to include in the ATP calculation. Note that supply that falls on a non–manufacturing workday is considered available on the next manufacturing workday. All supply must have a scheduled due date within the ATP rule’s past due supply days window.
Oracle Inventory lets you manage your inventory levels using any combination of the system’s planning and replenishment features, including min–max planning, reorder point planning, kanban replenishment, and a replenishment system for generating orders.
Inventory planning involves answering 3 questions:
When to Order?
Typically, you should order when:
on-hand quantity + supply - demand < minimum inventory level
The minimum level is a safety stock designed to be on an exception basis to meet
demand or inventory while waiting for replenishment.
How Much to Order?
Typically you should order a quantity that balances the cost of placing an order with the cost of carrying inventory while covering expected demand. You then create a requisition to replenish inventory from another organization or a supplier.
Which Planning Methods to use ?
• Reorder-point planning (organization)
• Min-max planning (organization and subinventory)
• Replenishment Counting
• Vendor managed
• Kanban planning
• Material-requirements planning: Master Production Scheduling/Master Demand Scheduling (organization)
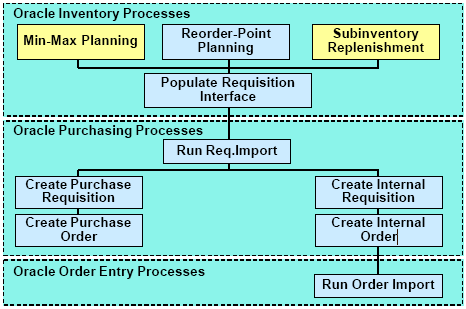
When you define an item or an item–subinventory relationship, you can specify attributes that modify your order quantities. You can use them to model supplier constraints that restrict the size of an order or mandate a specific lot size. You can specify minimum and maximum order quantities and fixed lot size modifiers. For replenishing subinventories, these same order modifiers can be set by item at the subinventory level.
If an order is smaller than the minimum order quantity, Inventory modifies the order upward to the minimum order quantity. Likewise, if the order is larger than the maximum order quantity, it modifies it downward to the maximum order quantity. An order must be a multiple of the fixed lot size multiplier. If it is not, it is revised upward so that the order is such a multiple.
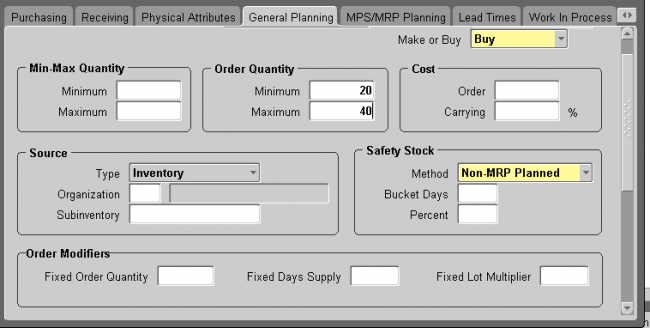
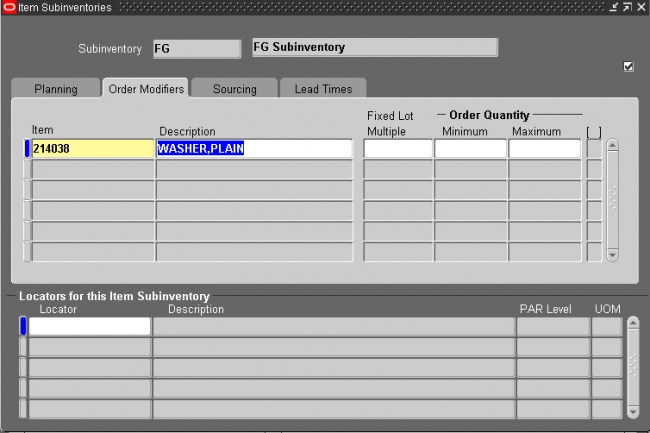
Reorder point planning uses demand forecasts to decide when to order a new quantity to avoid dipping into safety stock.
Reorder point planning suggests a new order for an item when the available quantity—on–hand quantity plus planned receipts—drops below the item’s safety stock level plus forecast demand for the item during its replenishment lead time. The suggested order quantity is an economic order quantity that minimizes the total cost of ordering and carrying inventory. Oracle Inventory can automatically generate requisitions to inform your purchasing department that a replenishment order is required to supply your organization.
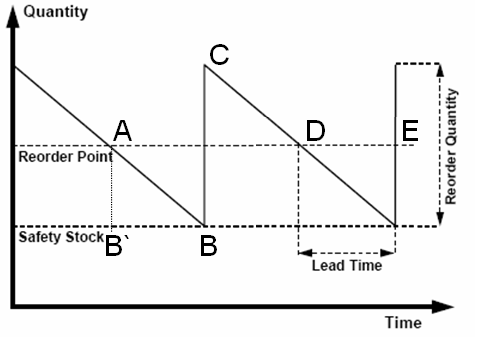
Safety Stock Safety stock for an item is the quantity of an item that you plan to have in inventory to protect against fluctuations in demand and supply. You can enter your own safety stock quantities, or Oracle Inventory can calculate safety stock based on an existing forecast for the item.
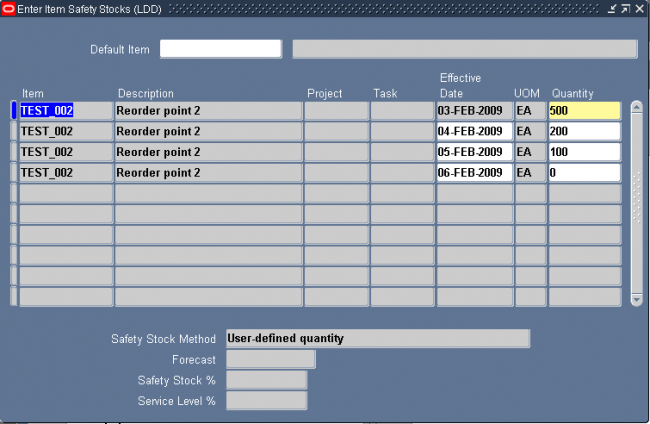
Item Demand The reorder point planning routine uses the average demand during the replenishment lead time. Oracle uses forecast information to calculate average demand.
On a normal circumstance its a summation of all the forecats.
Replenishment Lead Time Replenishment lead time is the total time between recognizing the need for items and the receipt of items. You can enter three components of order-processing lead times:
• Preprocessing lead time
• Processing lead time
• Postprocessing lead time
Oracle Inventory calculates reorder point planning lead time by adding all three components of processing lead time.
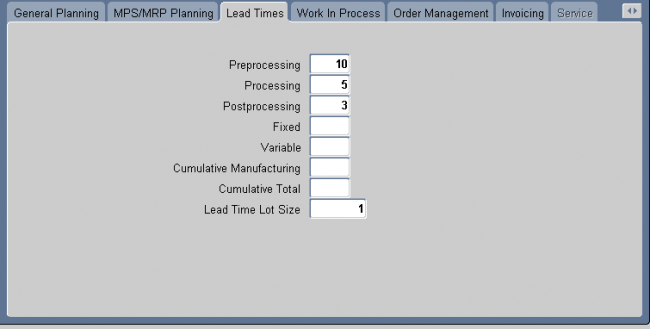
EOQ/Reorder Quantity
Reorder quantity = Economic Order Quantity (EOQ)
The economic order quantity is the quantity that minimizes the total cost of ordering and storing inventory.
EOQ = SQRT {[2 * (annual demand) * (order cost)]/(carrying cost percent *unit cost)}
Annual carrying cost = carrying cost percent*unit cost
Oracle Inventory calculates annual demand information from the forecast that you provide when you perform reorder point planning.
The EOQ increases as demand increases, since the cost of carrying a larger order is smaller because the inventory is not carried as long. EOQ also increases when the cost of preparing an order increases. This is to avoid making too many orders and thus incurring this cost more often than necessary. On the other hand, the more it costs to carry inventory, the smaller the EOQ since it costs more to carry the excess inventory.
You can constrain the reorder quantity by specifying the following information for each item:
• Fixed-lot multiplier
• Minimum order quantity
• Maximum order quantity
Order cost
The cost associated in ordering the item.
Carrying cost
The cost associated in carrying the item in inventory.
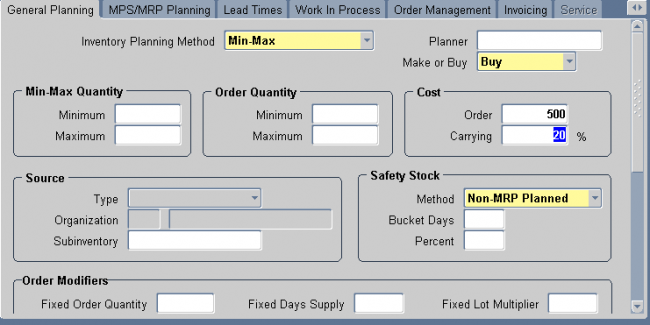
Oracle Inventory uses item safety stocks in the reorder point planning process. Safety stock is a floor or base level of inventory from which Oracle Inventory performs all planning. In other words, the item is planned as if the safety stock quantity for the period is the zero inventory balance of the item. This ensures that the safety stock quantity remains in inventory to cover any fluctuations in demand.
In businesses such as aerospace and defense manufacturing, or construction, it is normal to segrate supplies and demands by inventory ownership. Safety stock definition in such environments can be project specific. You can enter your own safety stock quantities or let Oracle Inventory calculate them based on an existing forecast for the item.
1. To manually enter a safty stock against an item.
Navigate to Inventory ->Planning -> Safty stock
and enter the item and safty stock
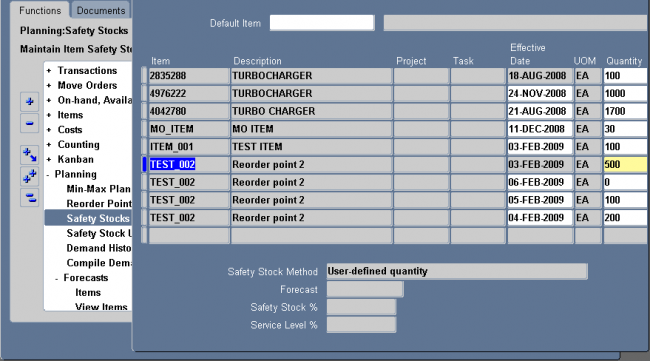
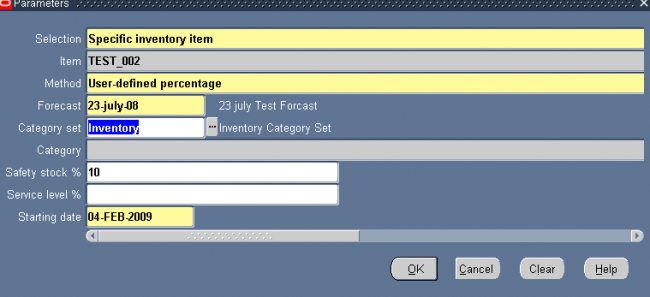
Kanban is a means of supporting pull–based replenishment in manufacturing systems. A Kanban system is a self–regulating pull system that leads to shorter lead times and reduced inventory. Kanban systems are typically applied to items that have relatively constant demand and medium–to–high production volume.
Kanbans represent replenishment signals that are usually manual and highly visible, such as a color–coded card that moves with the material, a light that goes on when replenishment is required, or an empty bin that is moved to the supply location to trigger replenishment.
The system includes an API that can be called by external systems, such as bar code readers, to trigger replenishment signals. Kanbans can be replenished from an external supplier or an internal organization.
The four types of kanbans available in the system trigger transactions that pull material from different replenishment sources.
Inter Org Creates internal requisitions
Intra Org Triggers material movement from a subinventory in the same organization
Production Creates or releases a production job (discrete job, repetitive schedule, or flow schedule)
Supplier Creates a purchase requisition
Kanbans are generally replenishable and cycle through the system from full to empty, remaining active until they are
withdrawn. One–time signals, called non–replenishable kanbans, are used primarily to manage sudden spikes in demand.
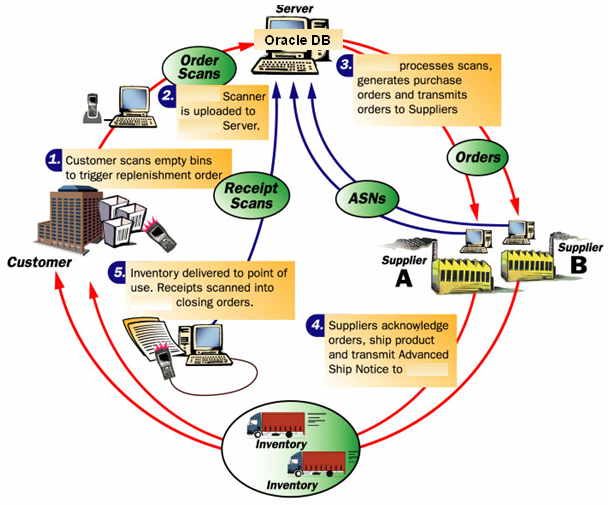
Inventory: (N) Items—>Master Item
To define a kanban planned item, you must set the Release Time Fence attribute in the MPS/MRP Planning attribute group to Kanban Item (Do Not Release). Only kanban planned items can be used in defining a pull sequence.
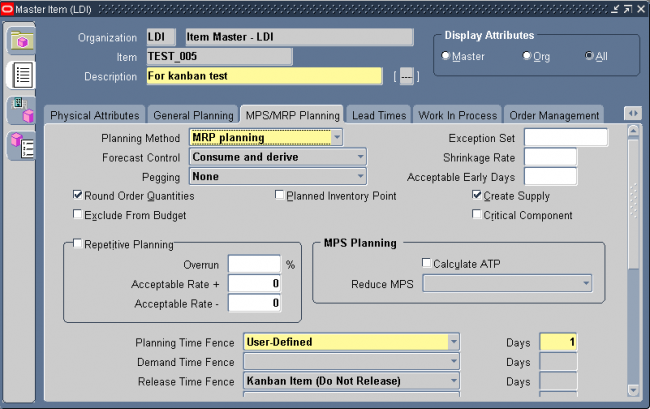
SOURCE TAB
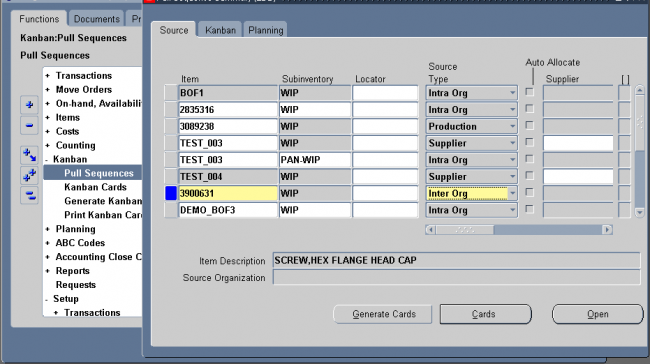
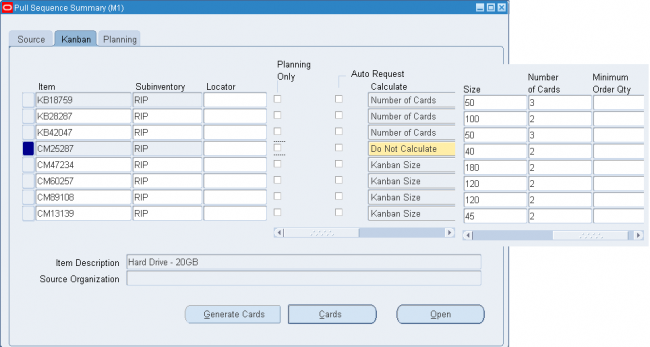
Kanban cards are created for an item, subinventory, and locator (optional). They are uniquely identified by a kanban number. For cards generated from a kanban pull sequence, the number is automatically generated. For manually defined cards, both replenishable and non–replenishable, you can enter an unused kanban number or let the system create the number.
Card Status
Kanban cards are generated with a default Card Status of Active. When you define a card manually, you can initially give it either Active or Hold status.
If the Supply Status is Full, you can temporarily pull a card out of the replenishment chain by changing the Card Status to Hold. You can later change the status back to Active. You can terminate use of a card by changing the Card Status to
Canceled, but you cannot reverse this change. Only Canceled cards can be deleted.
Supply Status
All the following Supply Status codes can be set either manually or automatically.
New The kanban has just been created and is not yet part of the replenishment chain.
Empty The kanban is empty and a replenishment signal has been generated (available only for Inter Org and Supplier source types).
Full The kanban has been replenished.
Wait The kanban is waiting until the minimum order quantity has been met by the aggregation of cards.
In–Process For the Supplier source type, the purchase order has been approved. For the Inter Org source type, the internal requisition has been approved.
All cards are generated with a status of New. You can switch this status to Empty to trigger a kanban replenishment signal. During initial setup, you can switch the status to Full if you are starting out with a full bin. When you are defining a card manually, you can create a card with a status of Empty, Full, or New.
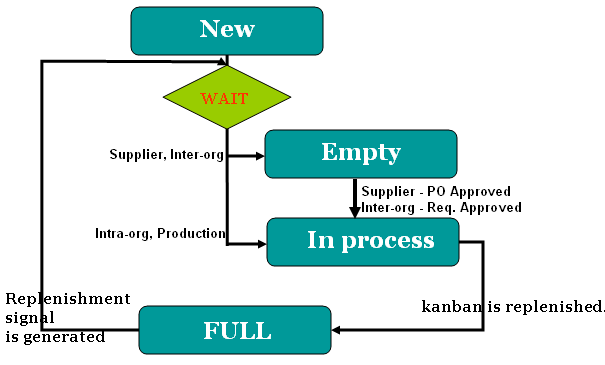
Defining Kanban Cards
Use the Kanban Cards Summary window to view, define, and update kanban cards. You can also automatically generate kanban cards with the Generate Kanban Cards process.
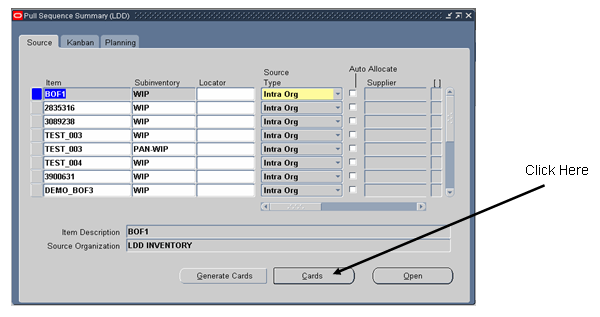
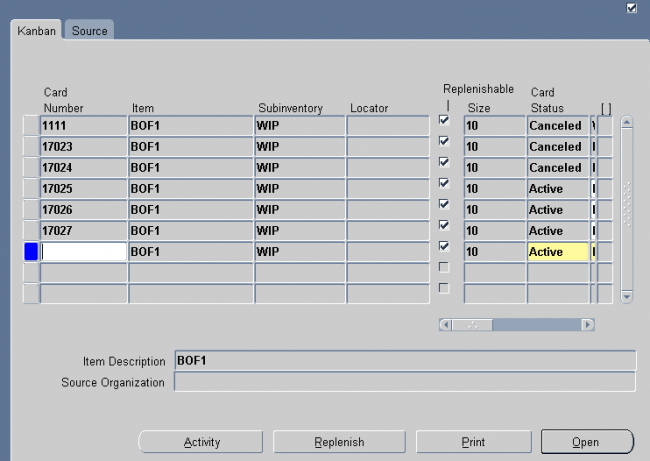
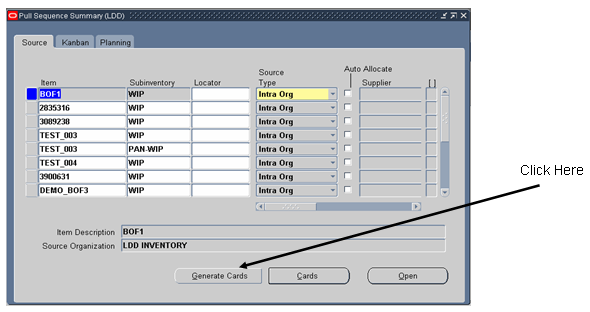
You can use min–max planning to maintain inventory levels for all of your items or selected items. With min–max planning, you specify minimum and maximum inventory levels for your items. When the inventory level for an item (on–hand quantities plus quantities on order) drops below the minimum, Oracle Inventory suggests a new purchase requisition, internal requisition, move order, or job to bring the balance back up to the maximum.
Oracle Inventory performs min–max planning for your items at either the organization level or the sub inventory level. Sub inventory level planning cannot generate jobs and does not consider WIP jobs as supply or WIP components as demand.
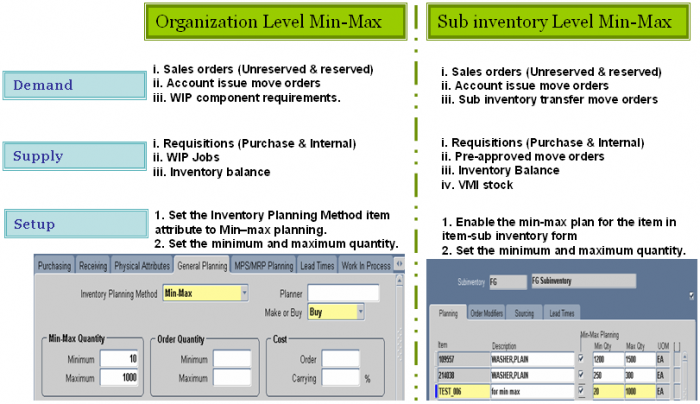
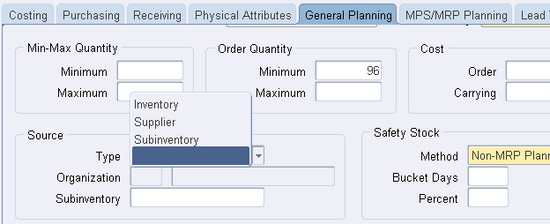
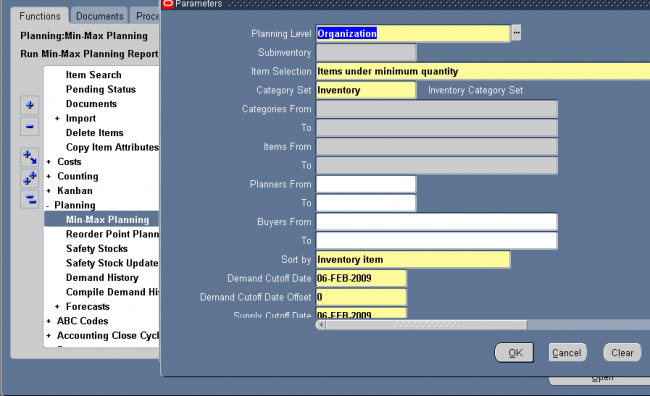
Use the Document Types window to define access, security, and control specifications for all Purchasing documents. You cannot enter new document types; you can enter new document subtypes only for RFQs and quotations.
Prerequisites
1. If you want to be able to choose the document approval hierarchy in this form, you must enable Use Approval Hierarchies in the Financial Options window.
2. You must use the Position Hierarchy window to create and update the position hierarchies, since Purchasing uses these hierarchies as document approval routing.
Select a Document Type from the list and click its icon in the Update column. If your document type is one of Purchase Agreement, Purchase Order, Quotation, Release, Request for Quotation, or Requisition you can update the attributes
discussed in the following steps.
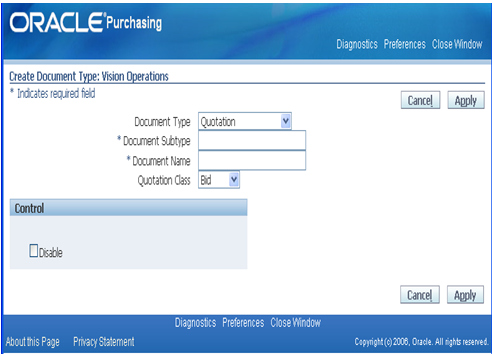
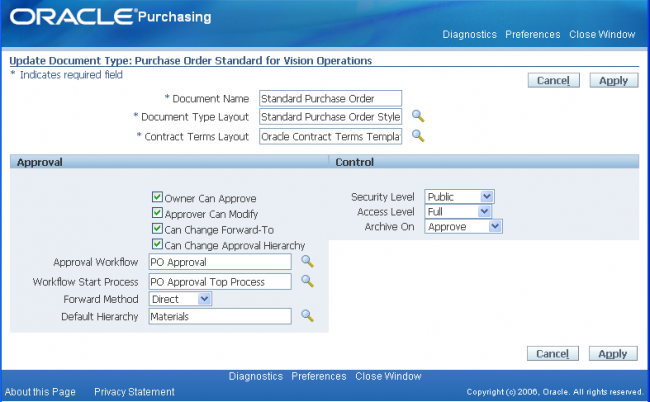


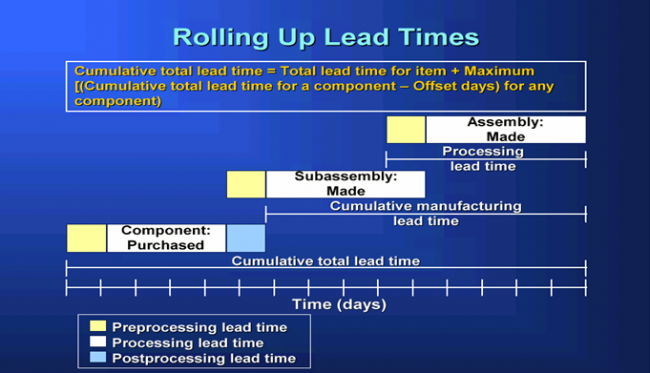
One of the most important tasks of a kanban planning system is determining the optimal number of kanban cards. The kanban planning software takes care of this calculation provided you enter correct values for kanban size, average daily demand for the kanban item, and the lead time to replenish one kanban.
By default, the standard calculation is:
(C – 1) * S = D * A * (L + SSD)
where:
• C is the number of kanban cards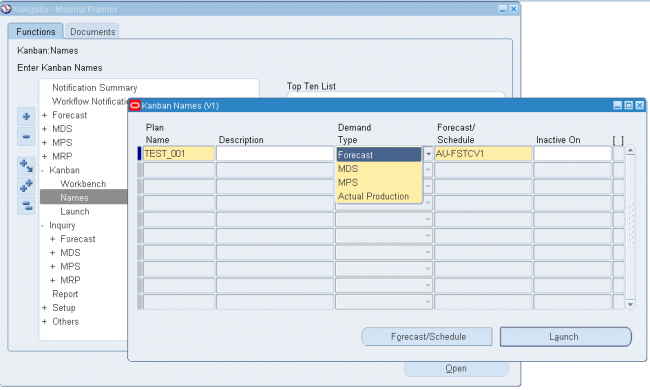
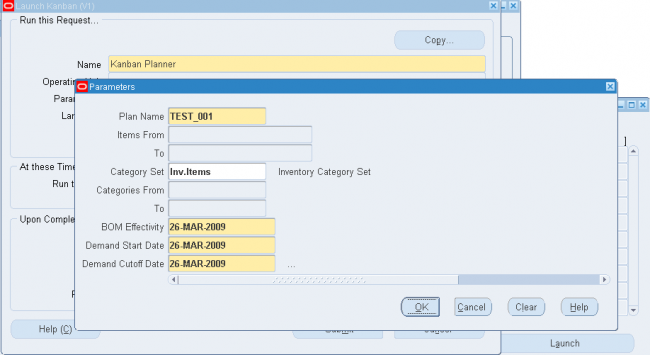
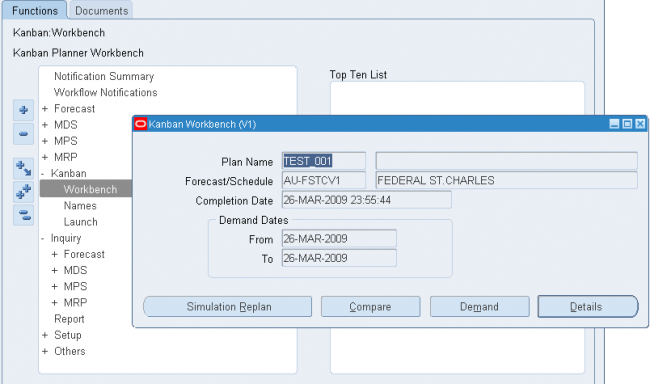
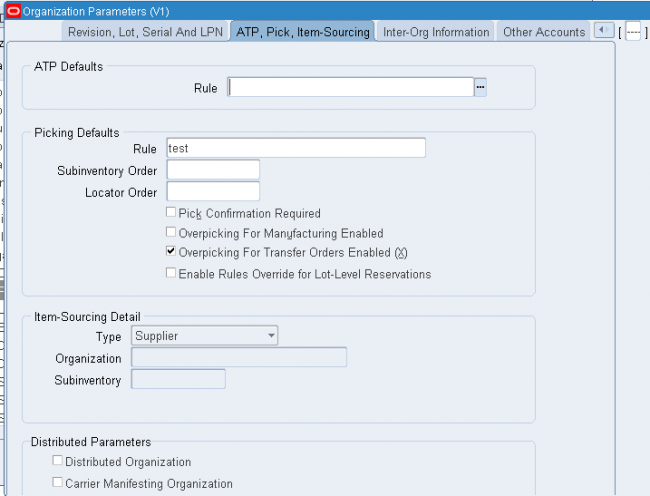
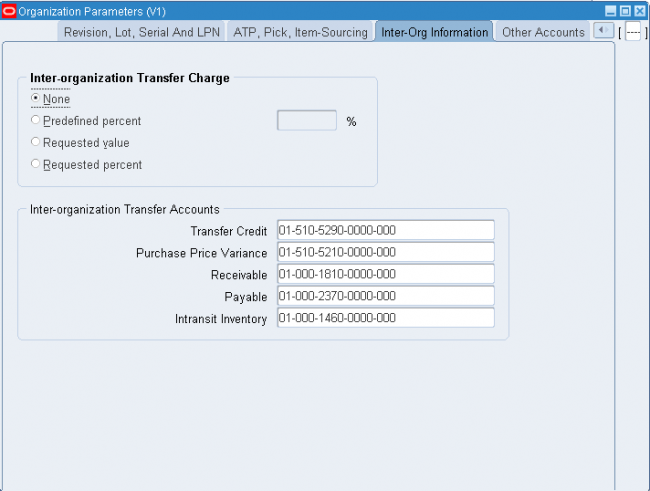
Users can see the number of pending transactions by navigating to the Inventory Accounting Periods Form.
Navigate > Cost > Accounting Close Cycle > Inventory Accounting Periods
Place cursor on the appropriate open accounting period and click on the [Pending] Button. There are three zones titled “Resolution Required”, “Resolution Recommended” and “Unprocessed Shipping Transactions”.
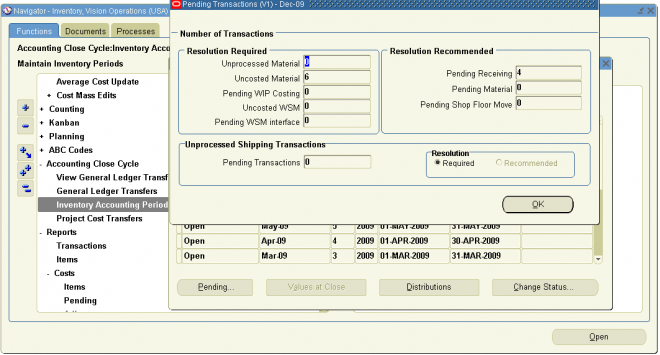
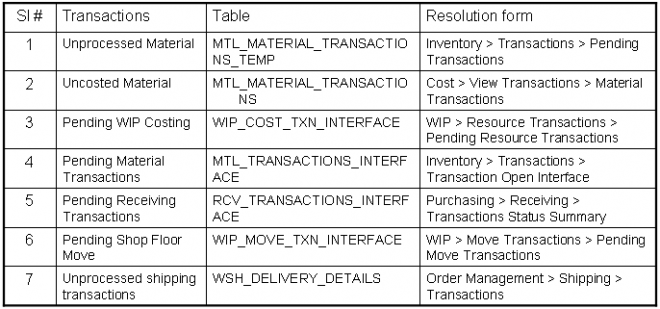
The first step in ventroy implemenation is to design the flex field structures.
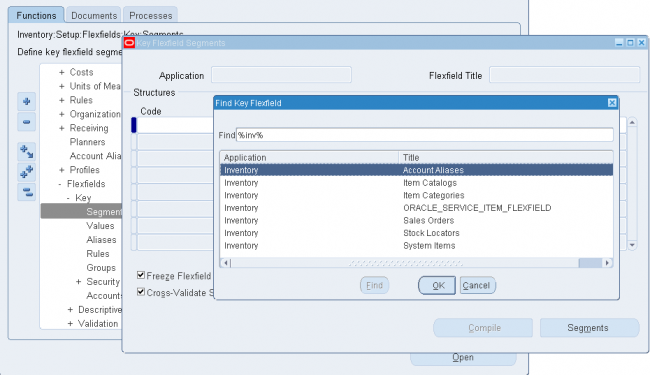
Oracle Inventory provides the following flexfields:
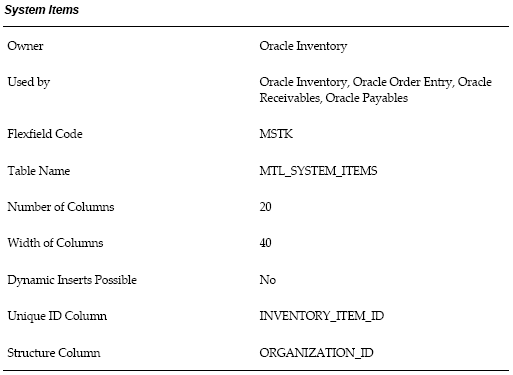
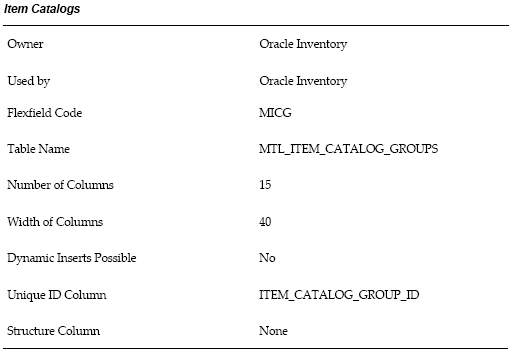
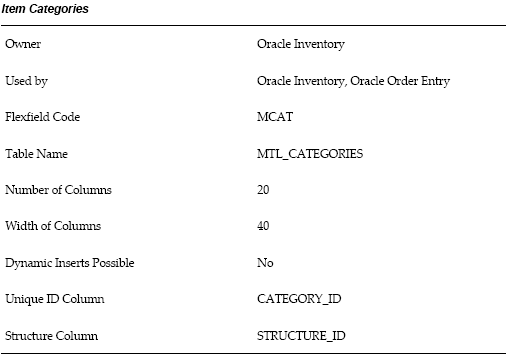
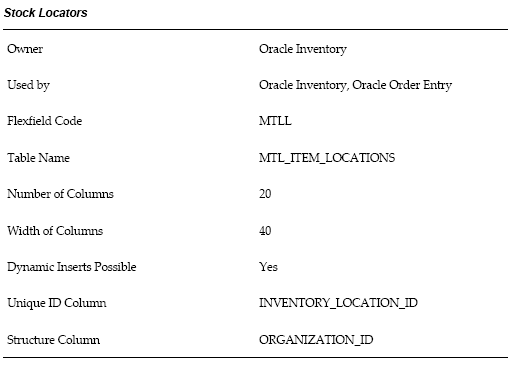
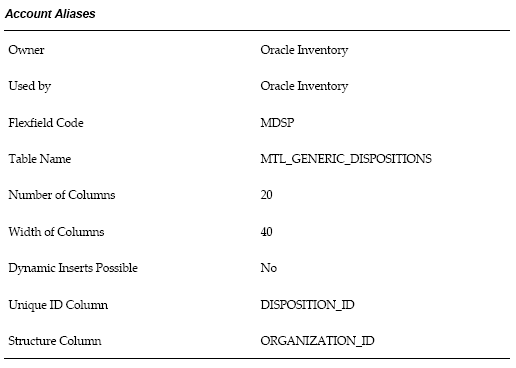
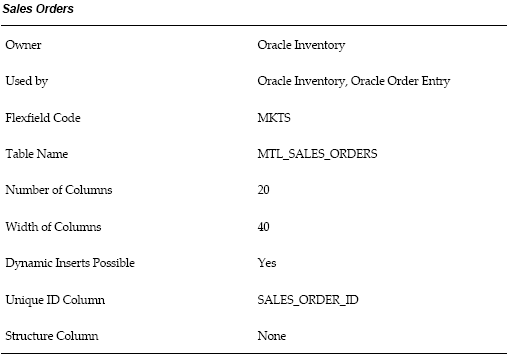
If we select the dynamic entry for locators then we can directly create the locators while do any transactions. To allow dynamic entery allowed for locators we need to do following two setups.
1. Make the stock locator as dynamic entery either at oraganization parameter or subinventory or at item level.
2. Allow dynamic insert should be enabled for the stock locator structure.
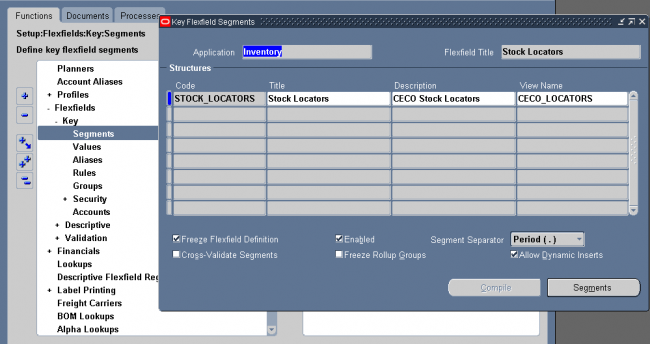
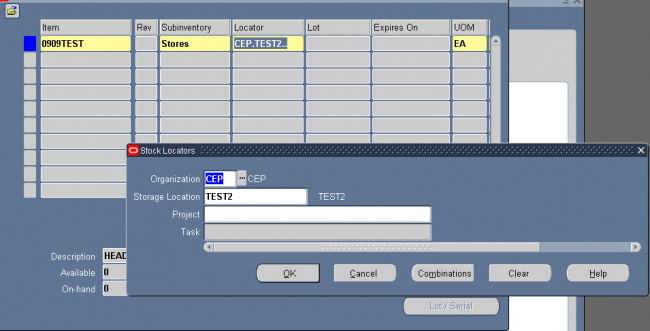
Oracle Inventory provides you with powerful methods for defining and manipulating units of measure. You can easily convert between the units of measure you define. This enables you to manufacture, order, or receive items in any unit of measure. With units of measure you can:
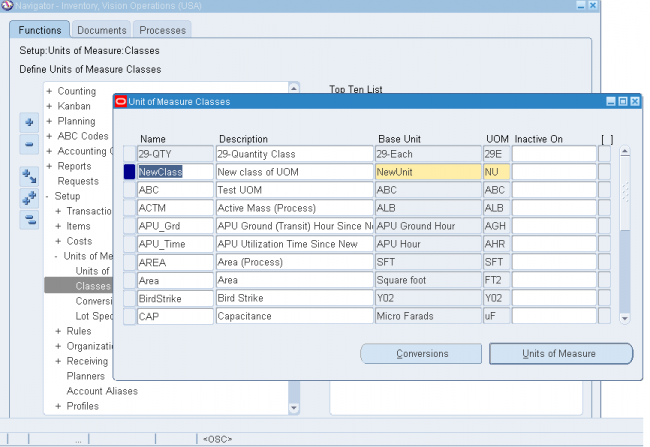
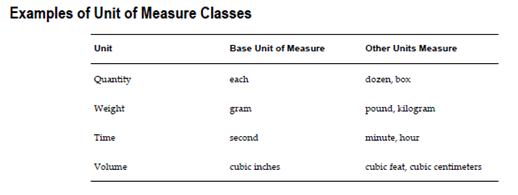
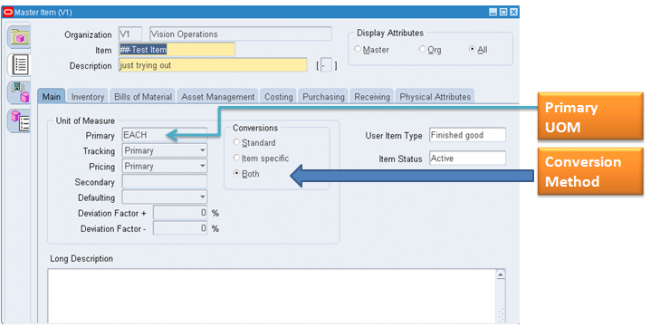
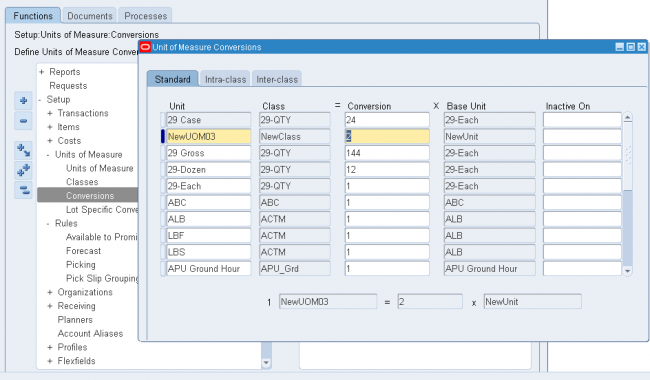
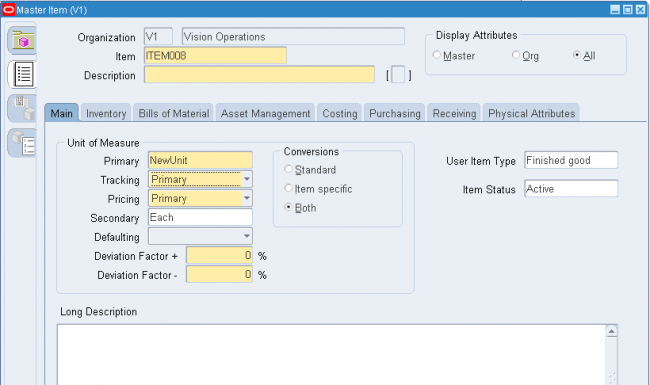
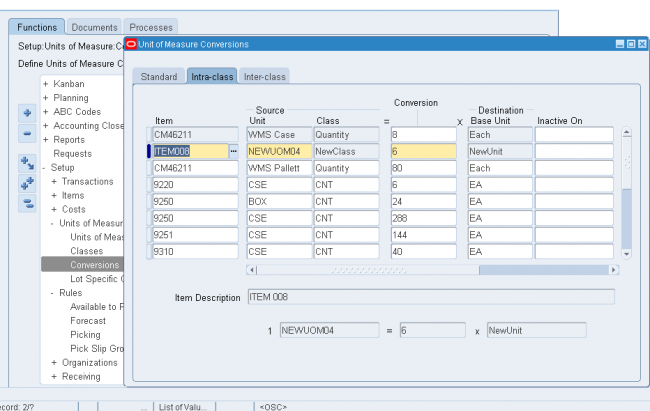
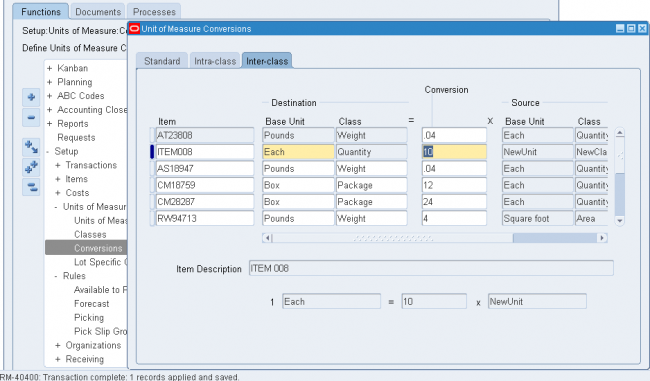
Lot specific conversions enable you to perform a specific inter-class conversion for a given lot. This enables you to establish more granular control over the transactional quantities of a lot. For example, the standard inter-class conversion for a lot controlled item is one gallon equals 15 pounds; however, when you receive a particular lot of the item, 1 gallon equals 16 pounds. You can create a lot specific unit of measure for this instance.
You can create lot-specific unit of measure conversions for on-hand lots or lots with a zero balance. If you create a lot-specific conversion for a lot with on-hand quantities, you can automatically update the quantities in the system to more accurately reflect the on-hand quantity.
You can also view the history of changes made to the lot unit of measure conversion, and the corresponding quantity changes.
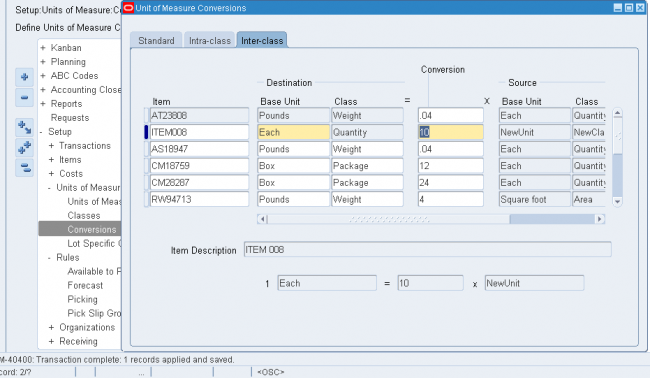
1. Enter the item number in the Item field.
2. Enter the lot number in the Lot Number field.
3. Select the destination base unit of measure of the class to which you are converting the unit of measure.
4. Enter the conversion factor by which the source base unit is equivalent to the destination base unit.
For example, if 16 pounds (source base unit) is equivalent to 1 Gallon (destination base unit), the conversion factor is 16.
5. Optionally, enter an inactive date for the conversion. This is the date when the unit of measure conversion for the lot reverts back to the standard inter-class conversion.
6. Optionally, enter a transaction reason for the conversion.

You can define and update material planners or planning entities for the current organization and assign them to inventory items at the organization level.
To define and update material planners or planning entities:
1. Navigate to the Planners window.
2. Enter a unique planner name. A planner can be a person or an entity, such as a department or a division.
3. Enter the electronic mail address of the planner.
4. Optionally, enter a date on which the planner becomes inactive. From this date on, you cannot assign this planner to an inventory item.
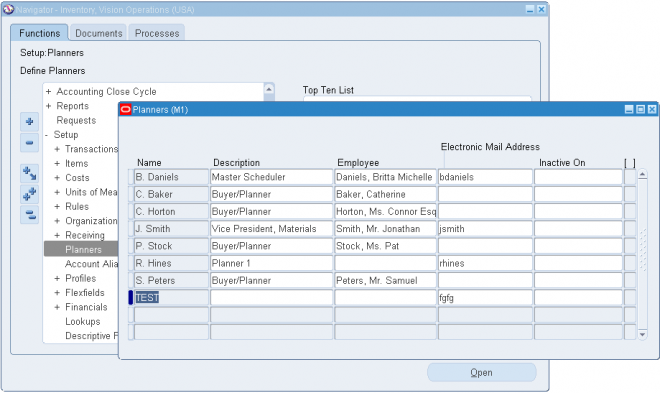
Shrinkage Rate
For a particular inventory item, you can define a shrinkage rate to describe expected scrap or other loss. Using this factor, the planning process creates additional demand for shrinkage requirements for the item to compensate for the loss and maintain supply.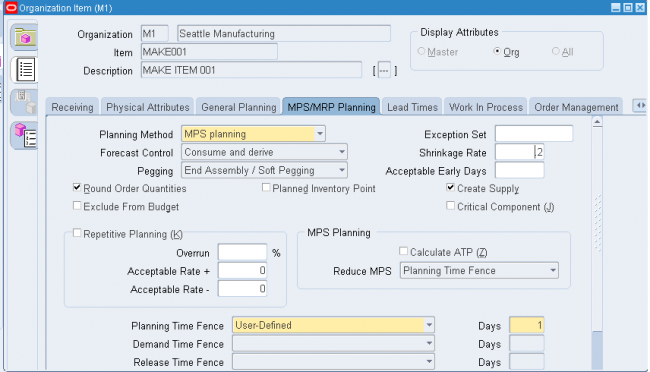
Component Yield
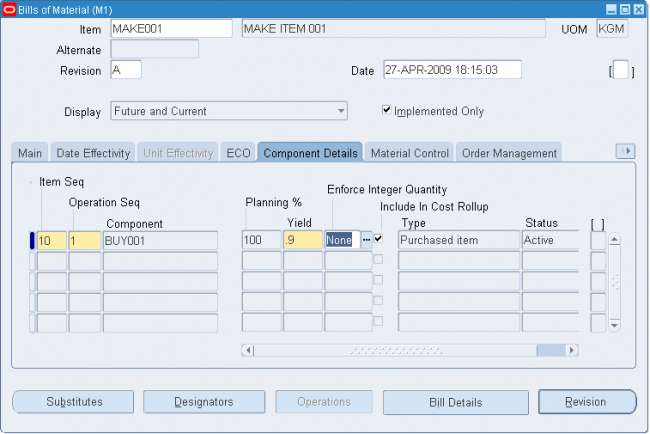
Safety stock is a quantity of stock you plan to remain in inventory to protect against fluctuations in demand or supply. Safety stock is sometimes referred to as over planning, forecast, or a market hedge. In the context of master scheduling, safety stock refers to additional inventory planned as protection against forecast errors or short term changes in the backlog. You can specify safety stock days together with safety stock percent as item attributes in Oracle Inventory. You establish the default use of safety stock calculation when you define your planning parameters. You can override this option for individual material plans when you generate an MRP or MPS using the Launch window.
Move orders are requests for the movement of material within a single organization. They allow planners and facility managers to request the movement of material within a warehouse or facility for purposes like replenishment, material storage relocations, and quality handling. You can generate move orders either manually or automatically depending on the source type you use.
Note: Move orders are restricted to transactions within an organization. If you are transferring material between organizations you must use the internal requisition process.
Managed Material Flow in a Facility:
Move orders allow you to distinguish between inventory management processes and the actual material transaction process. This provides for the following:
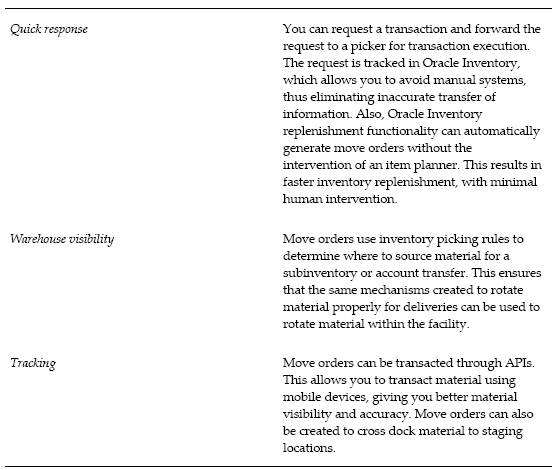
A move order comprises the following:
Move order header
Oracle Inventory uses the move order header to store the move order source type. This refers to the entity that created the move order. The header also stores the default source and destination (if known), the order number, and the requested date.
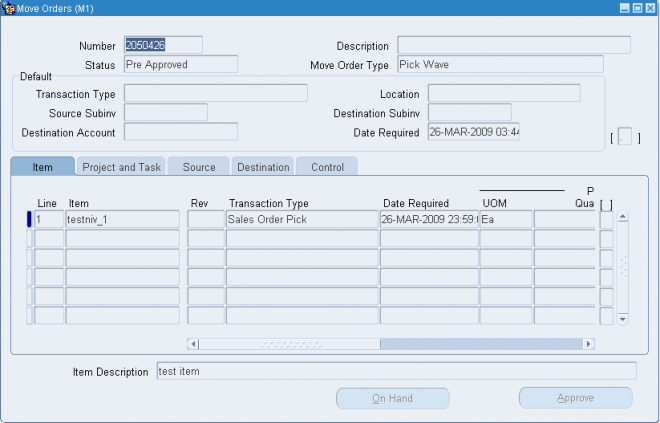


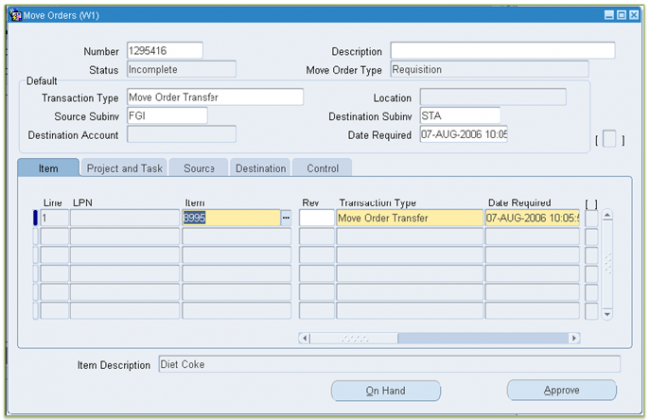
Define the Subinventory source type
To automatically create move orders using min-max planning and replenishment counting, you must define the sub inventory source type at once of the following levels:
If you require planner approval for move order requisitions, you can use the move order approval process, which forwards move order lines to the designated item planner for approval. Oracle Inventory manages the approval process through Oracle Workflow.
To govern the move order approval process, you set two inventory organization parameters:
You can create grouping rules to organize how picking lines for released sales orders and manufacturing tasks are grouped on pick slips. For example, if you select Delivery as a grouping criteria, all picking lines for the same delivery are grouped together on a pick slip.
You can also select additional grouping attributes for your grouping rules. For example if you select Delivery and Carrier as grouping criteria, picking lines for the same delivery and carrier are grouped together on a pick slip.
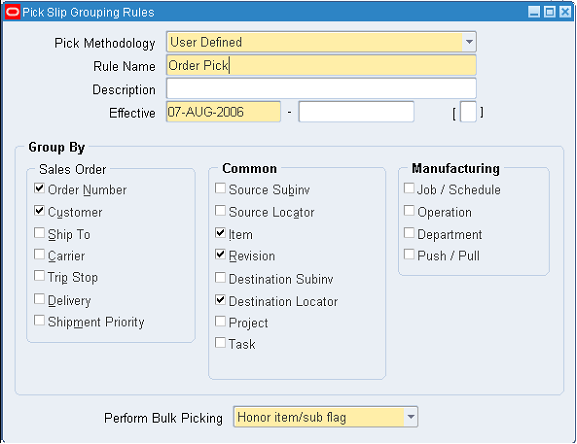
Receive an item against a supplier
1. Click on unordered and enter the supplier name in receipt form
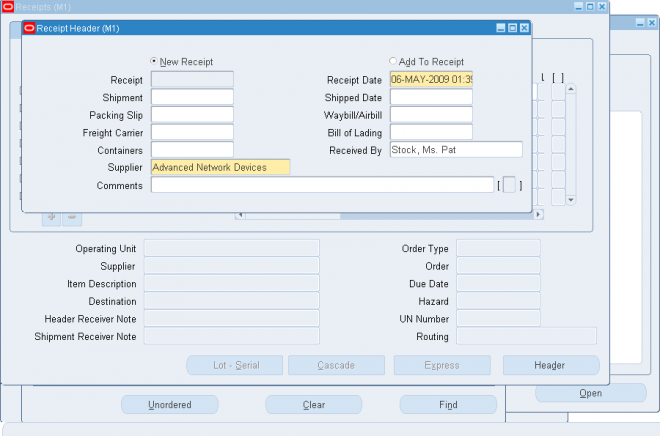
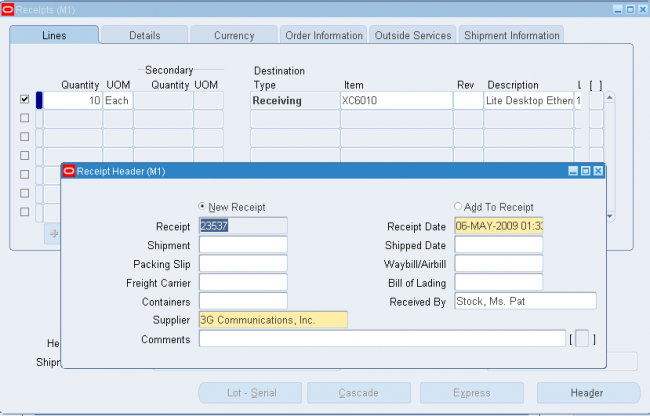
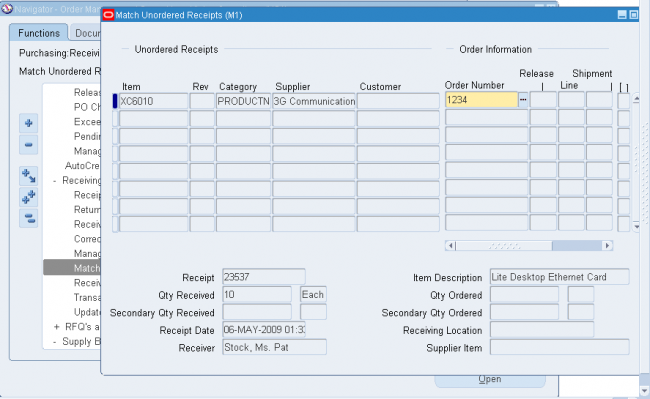
MAL - Match approval level
Match approval level, which determines whether the items on a purchase order line must be received and/or inspected before the corresponding invoice can be paid.
The Invoice Close % tolerance for your shipments. Purchasing automatically closes a shipment for invoicing if it is within the invoicing closing tolerance at billing, when Payables matches invoices to purchase orders or receipts.
The Receipt Close % tolerance for your shipments. Purchasing automatically closes a shipment for receiving if it is within the receiving closing tolerance at the receiving close point.
Note also that in the Find Expected Receipts form you have the option to include closed purchase orders when you are entering search criteria. You can override this option for specific
items and orders
The Receipt Close Point, when the shipment is closed for receiving: Accepted (passed inspection), Delivered, or Received.
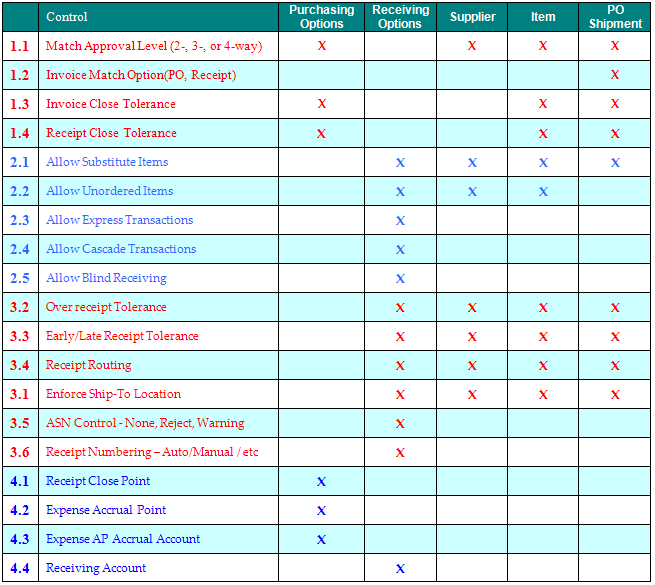
Use custom deletion constraints to enforce specific business rules. Custom deletion constraints prevent the deletion of bills or routings if your data meets the conditions set forth in the constraint.
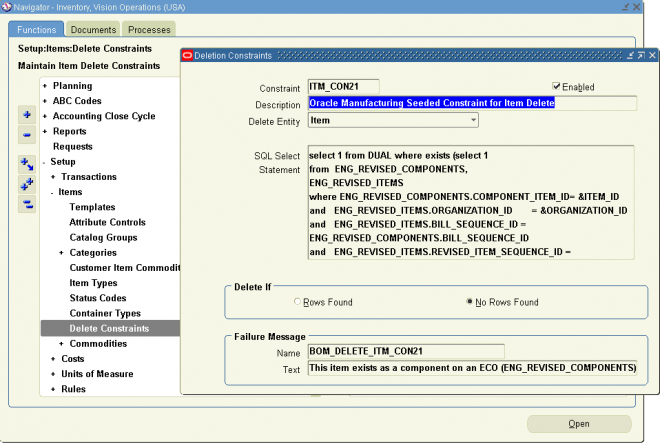
To create a custom deletion constraint:
1. Navigate to the Deletion Constraints window:
Inventory->Setup->Items->Delete Constraints
2. Enter a name for the deletion constraint.
3. Indicate whether the constraint is enabled. An enabled deletion constraint means that it is in effect when the delete concurrent program runs.
4. Select what kind of delete entity the constraint applies to: item, bill, routing, component, or operation.
5. Enter the SQL Select Statement that the delete concurrent program is to execute. You cannot update SQL statements for predefined deletion constraints.
6. Indicate whether to delete if there are rows found or no rows found by the SQL Select Statement
7. Enter a failure message from Oracle Application Object Library's message dictionary to display if the delete fails.
To delete an item which does not violate any delete constraint, navigate to Delete items window
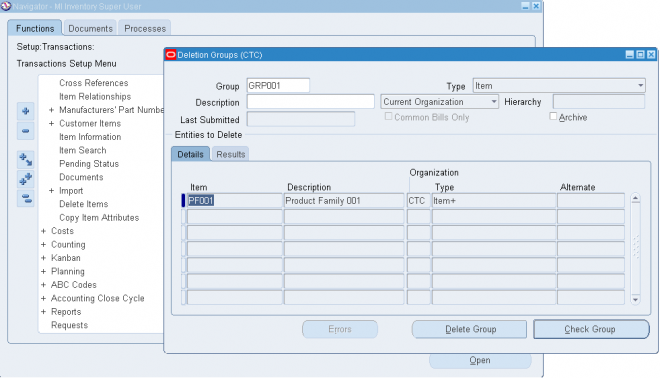
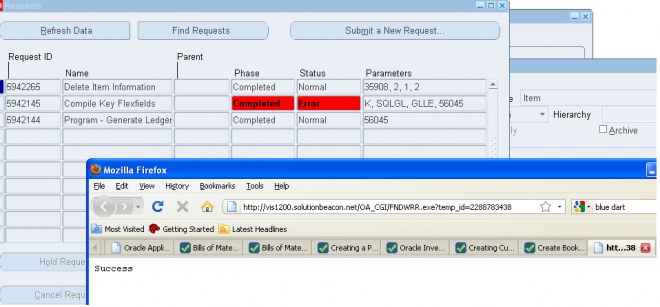
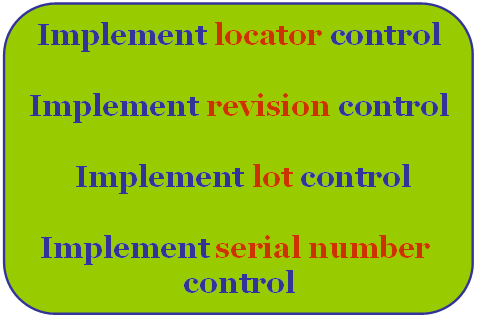
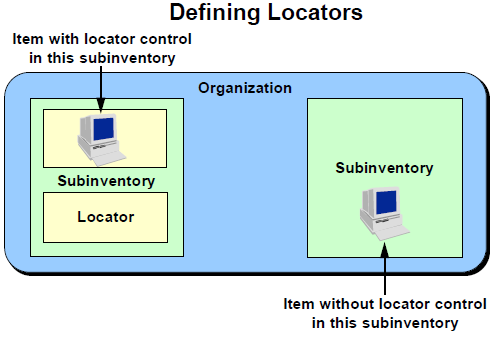
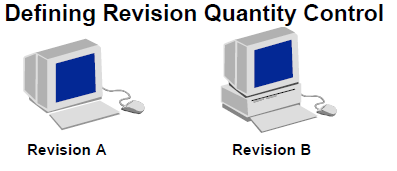
| A lot is a specific batch of an item that you receive and store in your organization. Lot control is a technique for enforcing the use of lot numbers during material transactions, thus enabling the tracking of batches of items throughout their movement in and out of inventory. With Oracle Inventory you can establish lot control for specific items in your organization. |  |
| A serial number is an alphanumeric piece of information that you assign to an individual unit of an item. A serialized unit is a combination of an item and a serial number. You can track individual units of items by using serial numbers. Serial number control is a system technique for enforcing the use of serial numbers during a material transaction. You can use serial numbers to track items over which you want to maintain very tight control. | 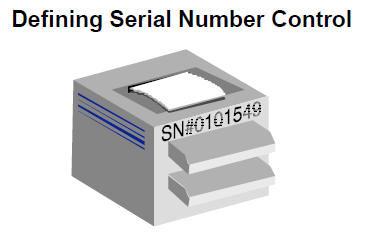 |
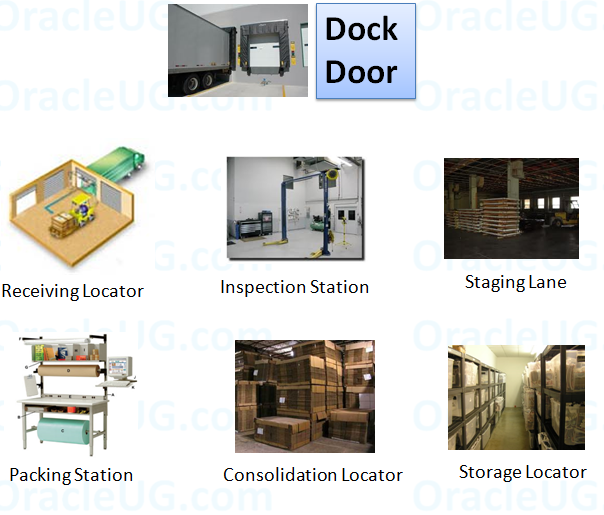
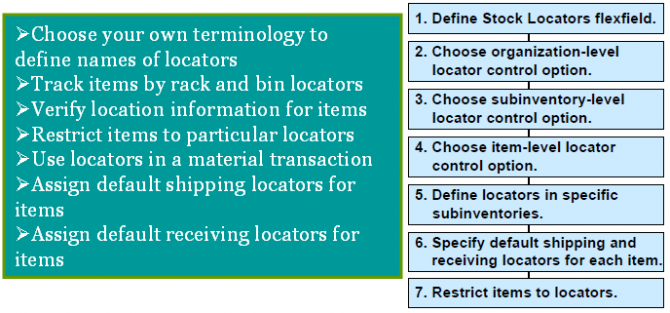

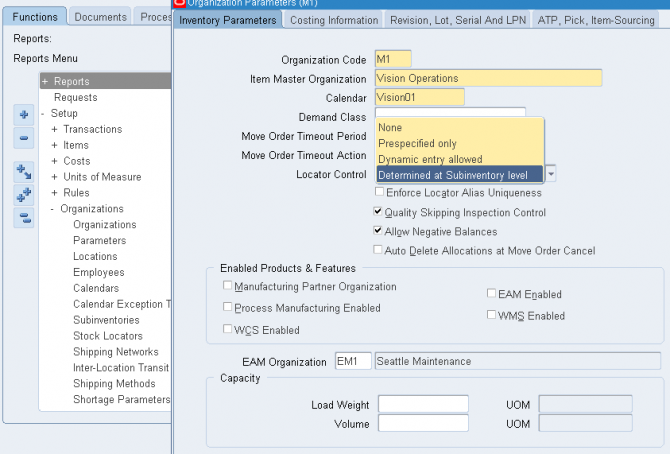
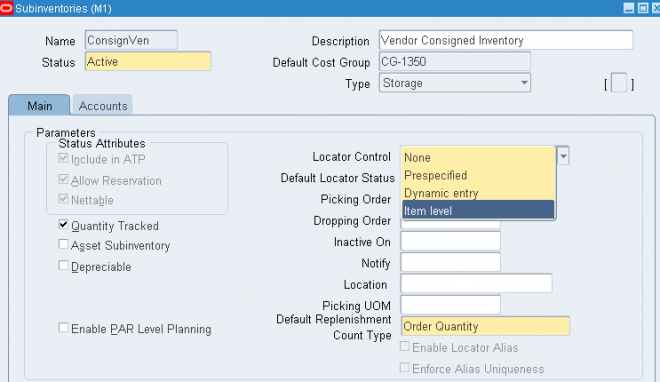
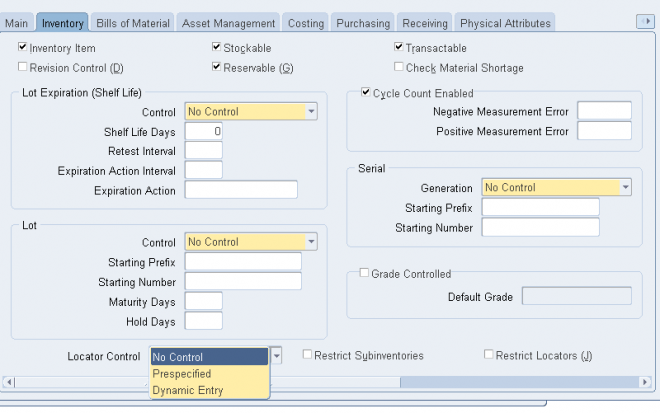
Prespecified Locators
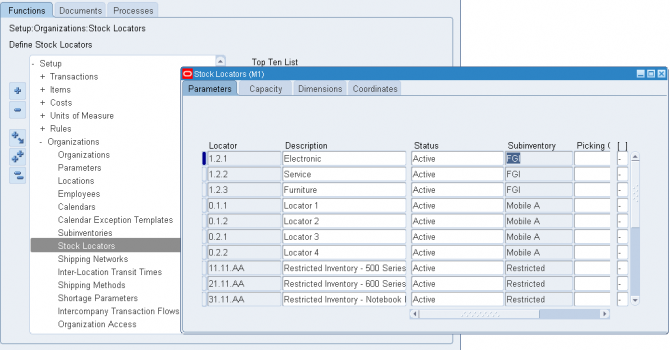
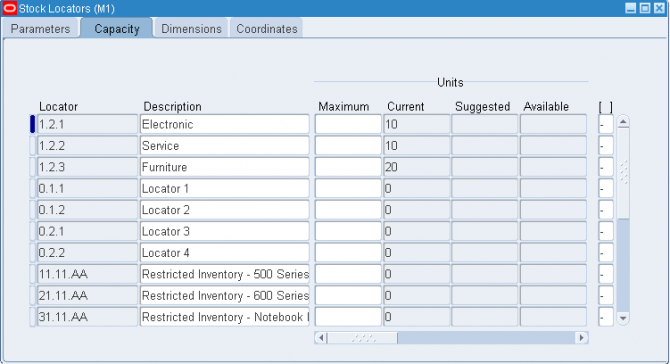

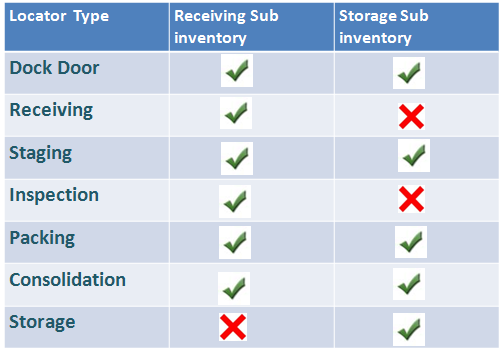
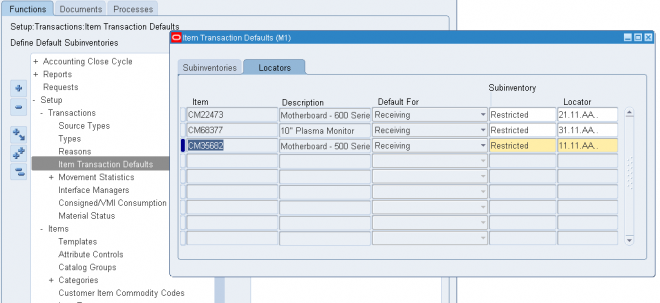
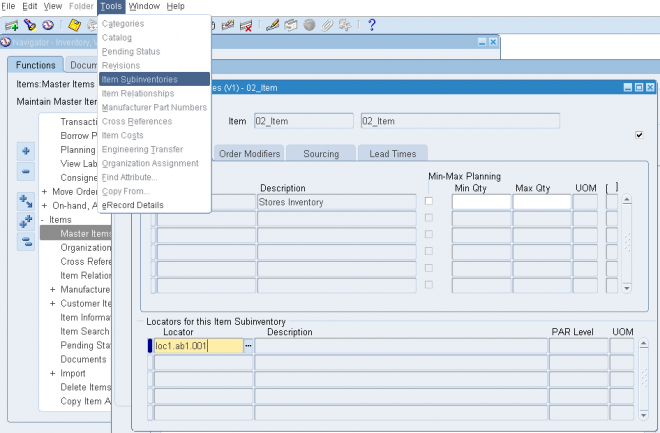
A revision is a particular version of an item, bill of material, or routing. You use revision quantity control to track item quantities by item revision. To do so you must specify a revision for each material transaction.
You can enable revision quantity control for items for which you must track version changes or changes that are significant enough to track but are not affecting the function and feature of the item and therefore do not require an item change.
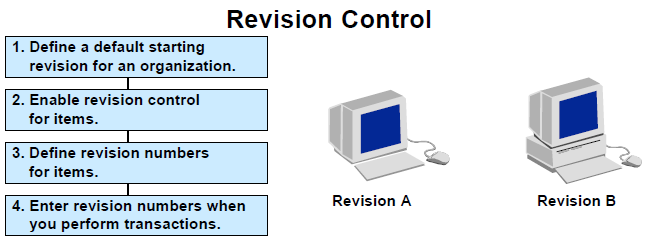
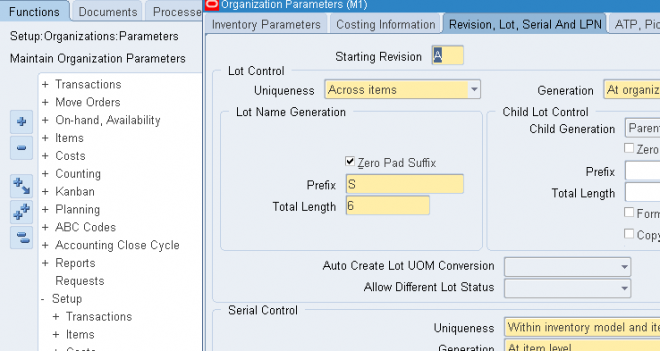
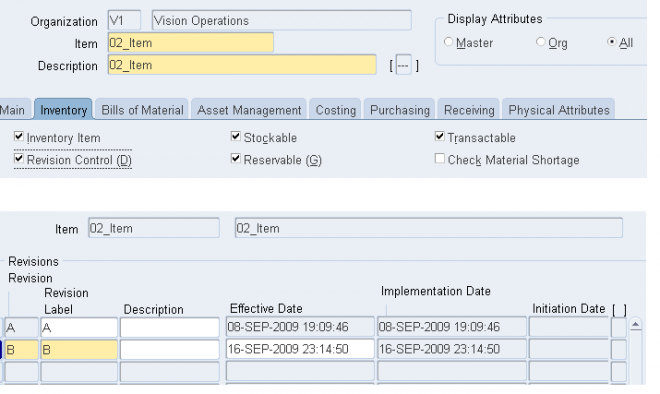
A lot is a specific batch of an item that you receive and store in your organization.
Lot control is a technique for enforcing the use of lot numbers during material transactions, thus enabling the tracking of batches of items throughout their movement in and out of inventory.
Oracle Inventory enables you to establish lot control for specific items in your organization.
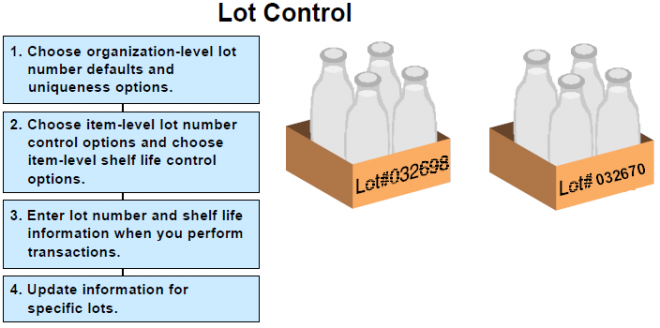
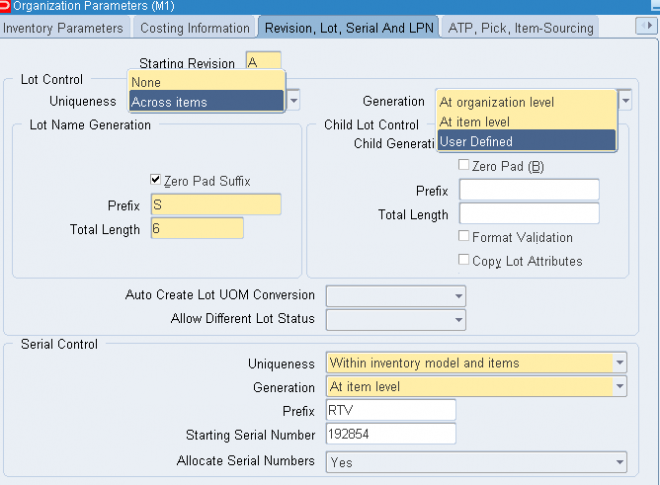
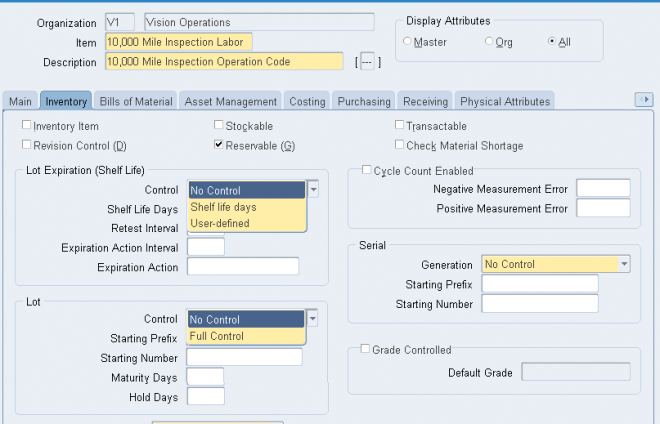
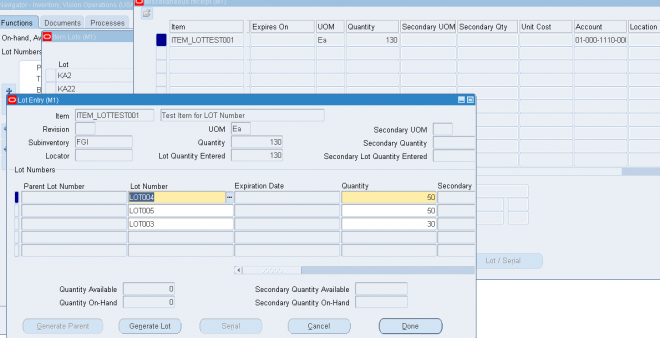
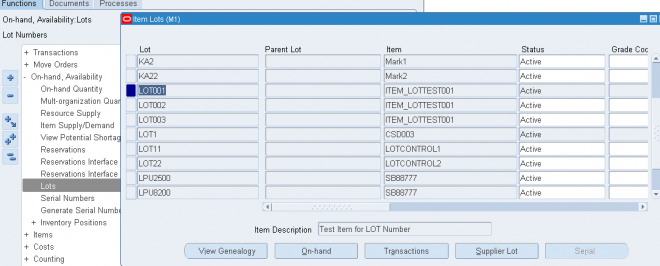
A serial number is an alphanumeric piece of information that you assign to an individual unit of an item. A serialized unit is a combination of an item and a serial number. You can track individual units of items by using serial numbers. Serial number control is a system technique for enforcing the use of serial numbers during a material transaction. You use serial numbers to track items over which you want to maintain very tight control.
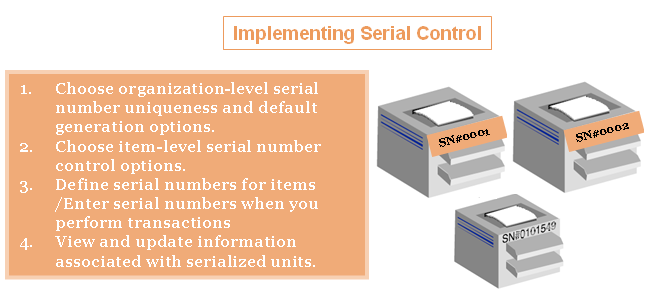
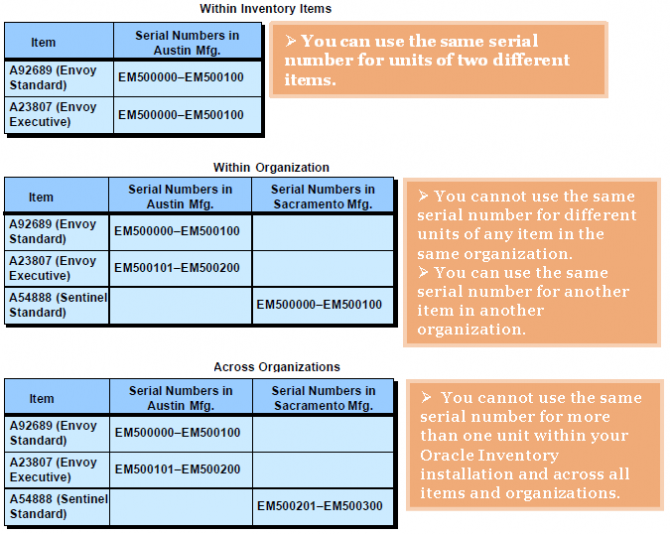
1. Choose organization-level serial number uniqueness and default generation options.
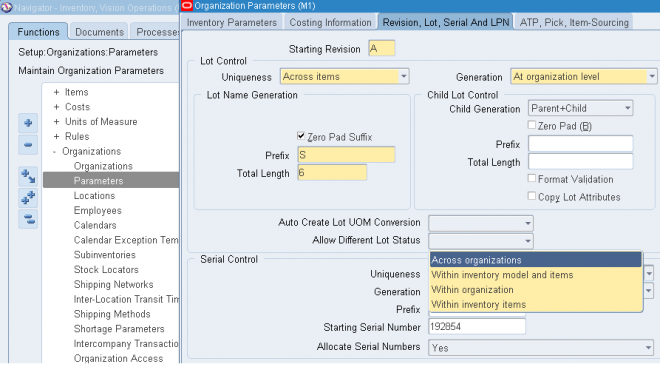
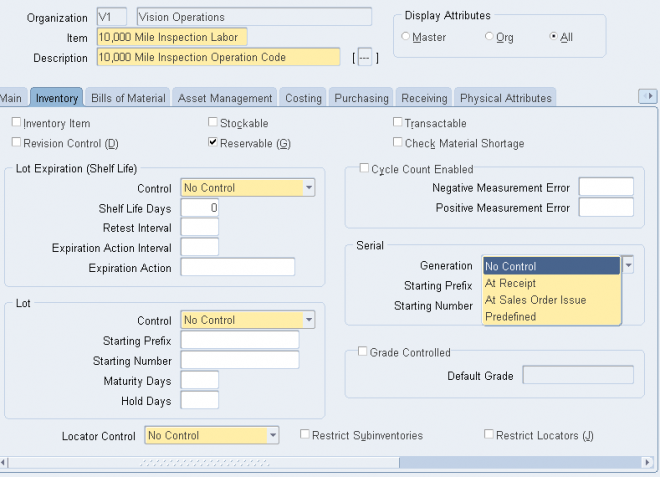
Picking Rules
When you define an item you choose a picking rule to determine the order in which revisions, lots, subinventories, and locators are picked for sales order. Oracle Shipping Execution submits requests to Oracle Inventory, which uses the information you enter in the Picking Rules window to generate pick lists for sales orders.
If you choose None for any of the criteria fields, Inventory ignores that criterion. For example, if you choose None for Revision, Inventory picks units of an item without regard to revision levels.
Oracle Inventory looks at the picking criteria in the order in which they appear in the Picking Rules window. Then, Inventory looks at the options (except for None options) for each criterion in the order in which they appear beneath each criterion.
To define a picking rule
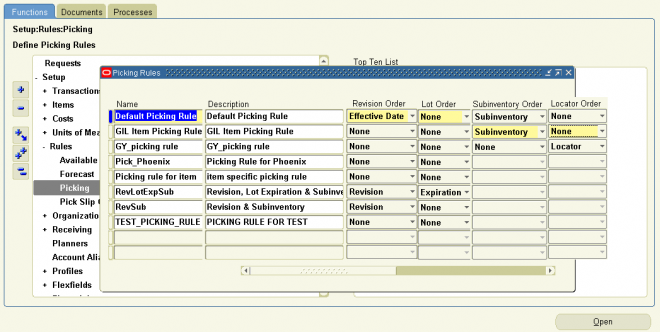
The transaction managers execute the following processes: material transaction, demand reservation, move transaction, resource cost transaction, remote procedure call, and material cost transaction. These run at periodic intervals you specify until you delete them with the concurrent manager. They control the number of transaction workers, processing intervals, and number of transactions processed by each worker during each interval. For descriptions of the available managers see: Transaction Managers.
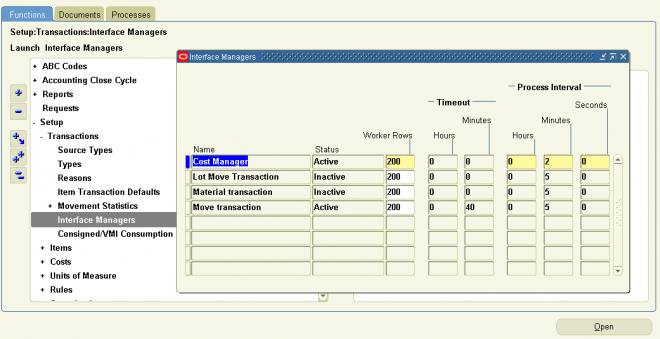
Costing Reports and Reconciliation
Costing reports are generally used to evaluate current inventory quantity and value, transactional history and to confirm what has transferred to the general ledger matches inventory values.
When closing an accounting period the ‘Close accounting period’ concurrent process (INCTPC) is kicked off as well as the ‘Transfer transactions to GL’ concurrent process (INCTGL). The ‘Close accounting period’ process summarizes the costs related inventory and manufacturing activities for a given account period. The ‘Transfer transactions to GL’ process distributes those cost to the general ledger.
Oracle provides a variety of reports for evaluating current inventory quantity and value as well as reconciling inventory and manufacturing transaction to what has been transferred to GL for a given period. The following is a list of the costing reports that should reconcile if run with the correct parameters dependent on the organization set up:
Period Close Reconciliation Report:
(Available 11.5.10, Executable CSTRPCRE) This concurrent program and report is used to create summarized transaction records. It displays the differences between accounted value and inventory in the Discrepancy column. The inventory value is used as the baseline for calculation for the next period summarization values. The Period Close Reconciliation report can be run at any time during the period or automatically during the Period Close Process by setting the profile option CST:Period Summary to either automatic or manual. If it is generated for an open period, you are creating a simulation, or snapshot of the period. If the program is run for an accounting period that is not in a Closed status, the report reads directly from a temporary table, The simulation status is indicated in the report title. (See Note 295182.1)
Standard Costing Organization, PJM/WMS Not enabled:
-Period Close Value Summary
-Inventory Value Report
-Subinventory Account Value Report
-Elemental Inventory Value Report
-Transaction Historical Summary report
Average Costing Organization, PJM/WMS Not enabled:
-Period Close Value Summary (for organization level balance only)
-Elemental Inventory Value Report – Average Costing
-All Inventory Value Report – Average Costing
-Transaction Value Historical Summary-Average Costing
FIFO/LIFO Costing Organization, PJM/WMS Not enabled:
-Period Close Value Summary (if there are no unsummarized intransit balance or layer cost update, for organization level balance only)
-Elemental Inventory Value Report-Average Costing
-All Inventory Value Report-Average Costing
-Transaction Value Historical Summary-Average Costing
Standard Costing Organization, PJM/WMS enabled:
-Period Close Value Summary – Warehouse Management
-Inventory Value Report – Warehouse Management
-Cost Group Account Value Report
-Elemental Inventory Value Report – Warehouse Management
-Transaction Historical Summary Report (for organization level balance only) with option value ‘Roll back to first Date’ set to the last day of the current period.
Average Costing Organization, PJM/WMS enabled:
-Period Close Value Summary – Warehouse Management
-Elemental Inventory Value Report – Average Costing
-All Inventory Value Report-Average Costing
-Transaction Value Historical Summary-Average Costing (if there are no intransit transactions in another organization that affects the intransit quantity in this organization)
FIFO/LIFO Costing Organization, PJM/WMS enabled:
-Period Close Value Summary-Warehouse Management (if there are no un summarized intransit balance)
-Elemental Inventory Value Report-Average Costing
-All Inventory Value Report-Average Costing
-Transaction Value Historical Summary-Average Costing (if there is no intransit transactions in another organization that affects the intransit quantity in this organization)
Reconciling Reports
-When reconciling reports insure that the correct report is being used depending on the organizational set up. Some customers do use other report combinations to reconcile and in some cases this is acceptable.
-Make sure that the reports (other than the Period Close Value Summary (-Warehouse Management), the Transaction Historical Summary Report and the Transaction Value Historical Summary-Average Costing) are run after all the transactions in the current period are costed and before transactions in the subsequent period are created.
-Back Dating Transactions: Oracle does allow customer to back date transactions for their business needs. Customers need to understand that back dating transactions can affect the balance when doing reconciliation but reconciliation issues can be avoided when back dating transactions by utilizing the Cost Cut off field in the Organization Parameter screen insuring that back dated transactions are costed in the correct sequence. The issue with back dating transactions is explained in the “PERIOD CLOSE SUMMARY ALGORITHM” document available at the url:
The period close process for perpetual costing enables you to
You can perform the general ledger transfer at any time during an open period—not just at period close. Interim transfers allow you to reconcile and transfer information weekly, making the month–end period close process much simpler and
faster.
The general ledger transfer loads summary or detail accounting activity for any open period into the general ledger interface, including both inventory and work in process entries. When more than one period is open, the transfer selects transactions from the first open period, up to the entered transfer date, and passes the correct accounting date and financial information into the general ledger interface.
For example, when you transfer detail entries, the transaction date is the accounting date with a line for line transfer. When you transfer summary entries with two periods open and enter a transfer date in the second period, the transfer process assigns the period one end date for all the summarized transactions in period one and assigns the entered transfer date for the summarized transactions in period two.
For each inventory organization, Cost Management transfers transactions to the general ledger interface table, line for line. If you transfer summary information, Cost Management groups transactions by GL batch, by journal category, by currency code, and by account.
Attention: Transfer in detail only if you have low transaction volumes. Transferring large amounts of detail transactions can
adversely affect General Ledger performance.
For both detail and summary transfers, Cost Management passes the organization code, GL batch number, batch description, and batch date. When you transfer in detail, you also pass the material or work in process transaction number. In General Ledger, you can see the transferred information, as follows:
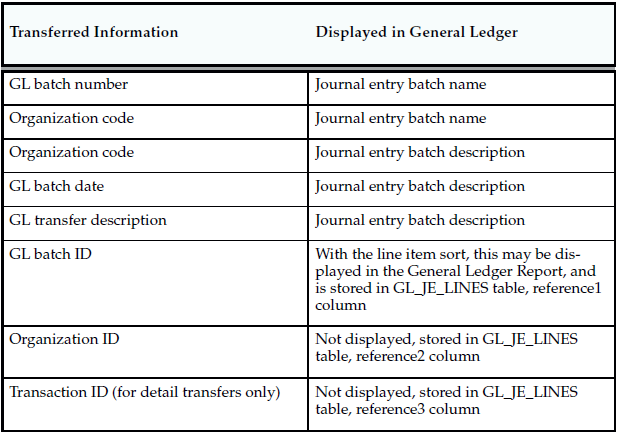
MTL_TRANSACTIONS_INTERFACE table is the Interface between non-Inventory applications and the Inventory Transactions module. In other words any other module other than Inventory that wants to update Inventory has to come through this table. Modules such as WIP (Work In Progress) and OE (Order Entry) first pass their records to the MTL_TRANSACTIONS_INTERFACE (MTI)for validation.
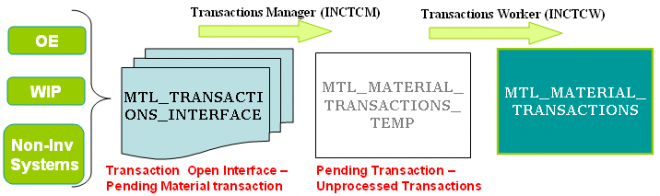
1. Enter all transactions.
Be sure you enter all transactions for the period. Perform all issues,receipts, and adjustments. Verify that no hard copy records exist or are waiting for data entry, such as packing slips in receiving.
2. Check Inventory and Work in Process transaction interfaces.You can set up the material and move transaction managers to execute transactions immediately, then submit an immediate concurrent request to execute, or submit a concurrent request periodically at a time interval you specify. If you do not use immediate processing, or interface external transactions, check the Inventory material transaction manager and the Work in Process move transaction manager before closing the period.
3. Check Cost Management cost interfaces.
Cost Management processes your inventory and work in process accounting transactions as a concurrent request, using a specified time interval. Before you close the period, you should check that the Cost Manager is active.
4. Check Order Management transaction processes. If you use Order Management, ensure that all sales order transaction processes complete and transfer successfully to Inventory.
5. Review Inventory transactions.
Before you close a period, review all of the transactions using the Material Account Distribution Report for the period with a high dollar value and/or a high transaction quantity. Check that you charged the proper accounts. Correcting improper account charges before you close a period is easier than creating manual journalentries.
6. Balance perpetual inventory.
Check that your ending perpetual inventory value for the period being closed matches the value you report in the general ledger. Perpetual inventory value normally balances automatically with the general ledger. However, one of the following sources can create a discrepancy:
– Other inventory journal entries. Journal entries from products other than Inventory that affect the inventory accounts.
– Charges to improper accounts: For example, you issued material from a subinventory to a miscellaneous account, but used one of the subinventory accounts as that miscellaneous account.
– Issue to miscellaneous account: For example, the following miscellaneous transaction issue would cause an out of balance situation: debit account specified at transaction 123, credit subinventory valuation account 123. The debit and credit net to zero with no financial charge, but since the inventory quantity decreased, the month–end inventory valuation reports will not equal the general ledger account balance.
– Transactions after period end reports. This occurs when you run the end of month inventory valuation reports before you complete all transactions for the period.
If you do not run the inventory reports at period end, you can also run these Reports:
– Inventory Value Report
– Material Account Distribution Detail Report
– Material Account Distribution Summary Report
– Period Close Summary Report
– Period Close Reconciliation report
– Inventory Subledger Report (Average Costing Only)
In a organization using Project Manufacturing Average Costing, if there is more than one cost group, the following valuation reports should not be used for reconciliation purposes because these reports list the average value across cost groups.
– Transaction historical Summary Report
– Receiving Value Report
– All Inventories Value Report
– Elemental Inventory Value Report
– Subinventory Account Value Report
– Item Cost Report
7. Validate Work in Process inventory.
If you use Work in Process, check work in process inventory balances against transactions with the WIP Account Distribution Report.
8. Transfer transactions in advance of closing period (optional).
If time permits, run the general ledger transfer process up to the period end date before closing the period.
Closing a period executes the general ledger transfer automatically. However, you can also run this process without closing a period using Transfer Transactions to General Ledger. Since you cannot reopen a closed period, running this process before period close allows you to proof the interfaced transactions and make adjustments to the period via new inventory transactions as necessary.
9. Close Oracle Payables and Oracle Purchasing.
If you use Payables and Purchasing, you need to close the accounting periods in the following order:
– Payables
– Purchasing
– Inventory
If you only use Purchasing and Inventory, you need to close Purchasing first. Close Payables before Purchasing, in preparation for accruing expenses on uninvoiced receipts. Doing so ensures that all new payables activity is for the new month and you do not inadvertently match a prior month invoice in payables to a new month receipt. When you close Purchasing or Inventory, you cannot enter a receipt for that period. However, as a manual procedure, close Purchasing before Inventory. This still allows miscellaneous transaction corrections in Inventory.
10. Run the Period Close Reconciliation report.
This report automatically runs in simulation mode for the open period. It is used to match account balances with inventory value at period end.
11. Close the accounting period and automatically transfer transactions to the general ledger.
This sets your Inventory Accounting Period status to Closed not Summarized. If the CST: Period Summary profile option is set to Automatic, no other steps are necessary. The period status is set to Closed when the summarization process has completed.
12. If the CST: Period Summary profile option is set to Manual, create period summarization transactions by generating the Period Close Reconciliation report.
The concurrent program creates summarized transaction records, and displays the differences between account balances and inventory value.
Oracle Inventory provides a fully automated physical inventory feature that you can use to reconcile system–maintained item on–hand balances with actual counts of inventory. Accurate system on–hand quantities are essential for managing supply and demand, maintaining high service levels, and planning production.
1. Define a physical inventory for your whole warehouse or subdivisions within your warehouse.
2. Take a snapshot of system on–hand quantities. You must procedurally coordinate the snapshot of your physical inventory with your actual counting, and ensure that no transaction activity occurs in a particular location until after you have performed your adjustments.
3.1 Generate alphanumeric tags.
3.2 Count the TAGs. Void unused or lost tags.
3.3 Approve or reject physical inventory adjustments based on approval tolerances.
4. Automatically post adjustments to inventory balances and general ledger accounts.
5. Purge physical inventory information.
You can define and maintain an unlimited number of physical inventories in Oracle Inventory. A physical inventory is identified by a unique name you assign. You use this name to identify any activity, such as adjustments, pertaining to this physical inventory.
You can define multiple physical inventories to count selected portions of your inventory, or you can count your total inventory. For example, if your warehouse has two large stockrooms, each represented by a subinventory, you can define two physical inventories, one for each subinventory. You can then perform your physical inventory of the first stockroom, independent of the second.
To define a physical inventory:
Navigate to the Physical Inventories Summary folder window and choose New. The Define Physical Inventory window appears.
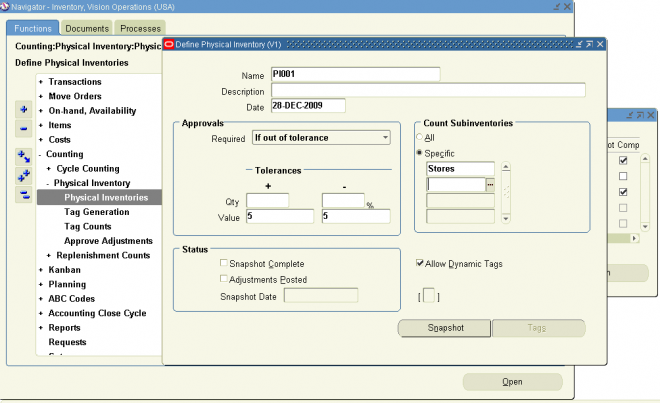
Before you can generate tags for a physical inventory, you must take a snapshot of all system on–hand quantities for your items. The snapshot saves all current item on–hand quantities and costs. Oracle Inventory uses this information as the basis for all physical inventory adjustments. All tag counts you enter for this physical inventory are compared with these static quantities. This allows you to resume normal inventory operations after you have entered your counts but before you have authorized all final physical inventory adjustments. You can perform your recounts or investigate certain results without holding up transaction processing.
Notes :
1. Oracle Inventory does not stop inventory processing during a physical inventory. Therefore, you must procedurally coordinate the snapshot of your physical inventory with your actual counting, and ensure that no transaction activity occurs in a particular location until after you have performed your adjustments.
2. It is recommended to clear the Pending Transactions and Transactions Open Interface, before taking a snapshot of inventory.
To freeze the system on–hand quantities
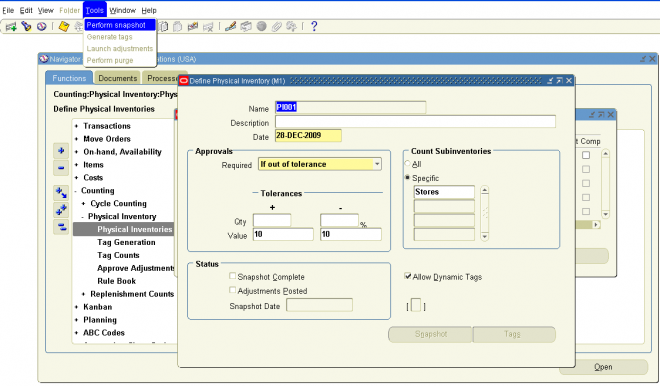
You use physical inventory tags to record the physical counts of inventory items. Physical inventory tags represent actual hard copy tags that some companies use to count inventory items. A tag contains the count for a group of a given item. Although you can record only one item on a tag, multiple tags can reference the same item, with each tag referring to a unique physical location for an item.
Note: A tag represent a single item number in a particular subinventory, locator with a given revision, lot, and serial number.
If we are not considering serial and lot number then the single TAG might have n number of items (in a particular sub-inventory, locator combinatio)
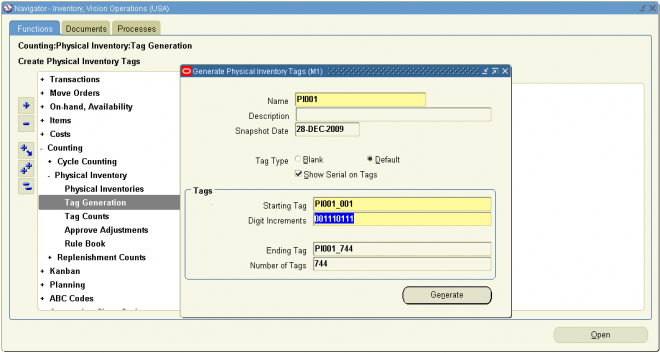
Use the tags that you generated to record your physical counts. If you use default tags for your physical inventory, you can automatically query all tags and fill in the counts. You can also query a subset of your tags by any combination of tag number, item, revision, subinventory, locator, lot, and serial number. You would use this partial tag query feature if you prefer to enter your counts by location or item, or for a particular tag number range.
If you use any blank tags in your physical inventory, you can query up the tags by tag number. You can then enter the necessary item, revision, subinventory, locator, lot, and serial number information, as well as the actual count quantity and the name of the employee who performed the count.
If you enable dynamic tag entry for your physical inventory, you can enter counts for any item and stock–keeping unit combination without a pre–generated tag number.
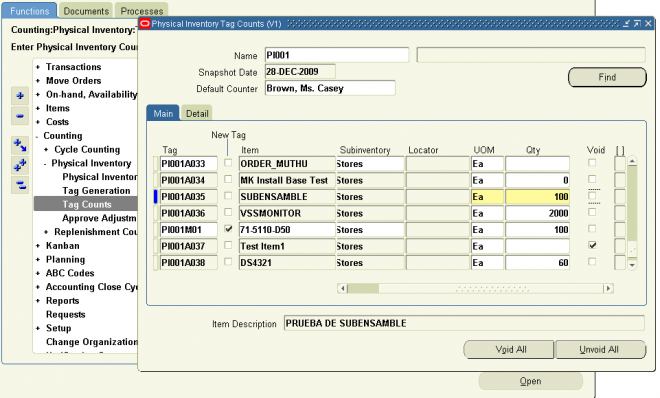
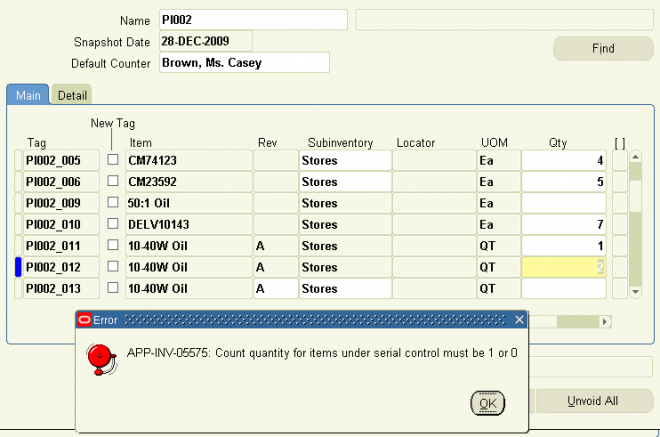
Approval Tolerances
Oracle Inventory supports two types of physical inventory approval tolerances. For each type, you can specify a positive and a negative limit. When a particular physical inventory tag count entry results in an adjustment that exceeds any one of these limits, you have a physical inventory adjustment that exceeds approval tolerances. Based on the approval option you chose when you defined your physical inventory, this adjustment is or is not held for approval.
If you decide that approval is required for adjustments out of tolerance you must enter at least one positive or negative value for one type of approval tolerance. The quantity variance tolerance is a user–defined limit for the difference between the system–tracked on–hand quantity and the actual tag count quantity. You express positive and negative quantity
variance tolerances as percentages of the system on–hand quantity. You enter these percentages when defining your physical inventory.
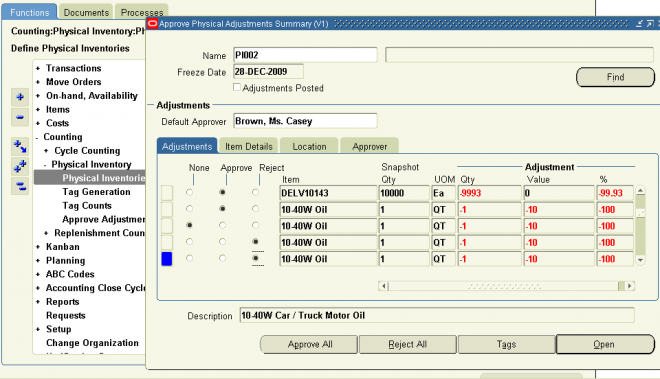
After you finish entering all your tag counts and approving those adjustments that need approval, you can submit the process that automatically posts your physical inventory adjustments. Oracle Inventory automatically creates a material transaction adjusting the item quantity and debiting or crediting the adjustment account you specify for your physical inventory.
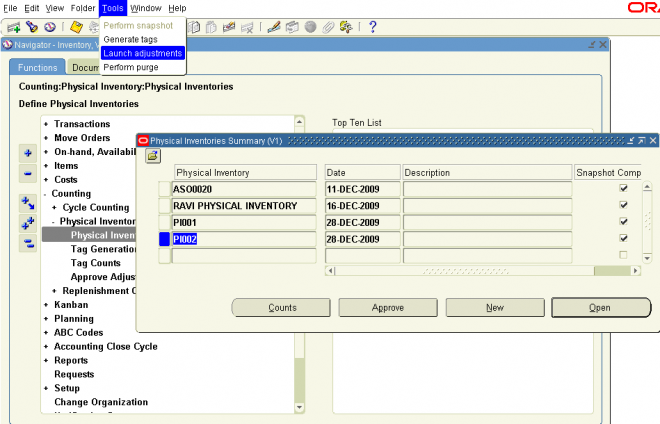
 "Perform physical inventory Adjustments" is complete one can verify the physiacl inventory adjustment material transactions and corresponding distribution accountings in material distribution window.
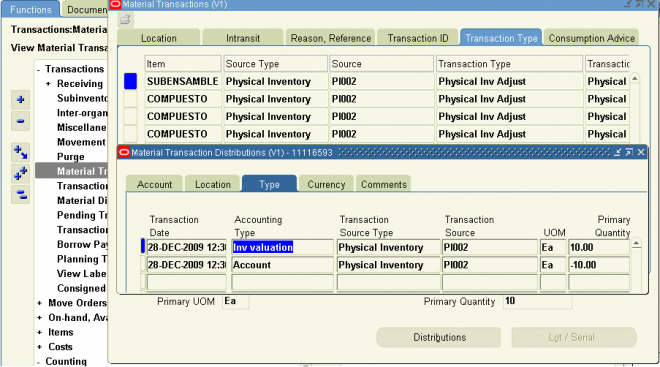
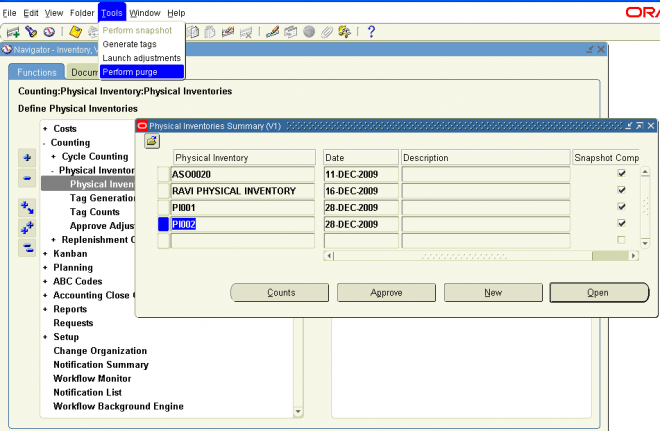
An ABC analysis determines the relative value of a group of inventory items based on a user–specified valuation criterion. ”ABC” refers to the rankings you assign your items as a result of this analysis, where ”A” items are ranked higher than ”B” items, and so on. You can optionally use the ABC analyses you compile to drive your cycle counts, where you might count items of high value (A items) very frequently, items of lower value less frequently, and items of lowest value very infrequently.
Steps Involved in ABC Analysis
Defining ABC Classes
You use ABC classes to identify the value groupings to which your items belong. You define these classes using your own terminology.
For example, you might define classes High, Medium, Low, and later assign your items of highest rank to the High class, those of lower rank to the Medium class, and those of lowest rank to the Low class. You can add to the list of classes you have already defined.
Attention: You must assign an ABC class to at least one ABC group.
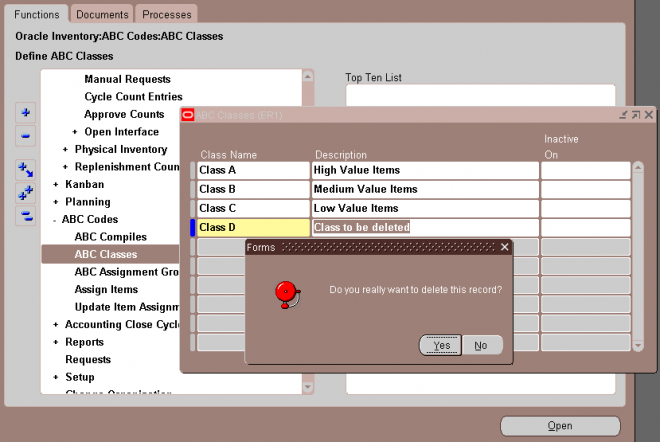
You can define and compile an ABC analysis for your entire organization or for a specific subinventory within your organization.
You choose the compilation criterion, the scope of your analysis, the cost type to use in determining item values, and any additional information that may be conditionally necessary, based on your compilation criterion. The combination of all these parameters constitutes an ABC compile header, identified by the ABC compile name. You use this name to identify any activity pertaining to this ABC analysis.
To define an ABC compile:
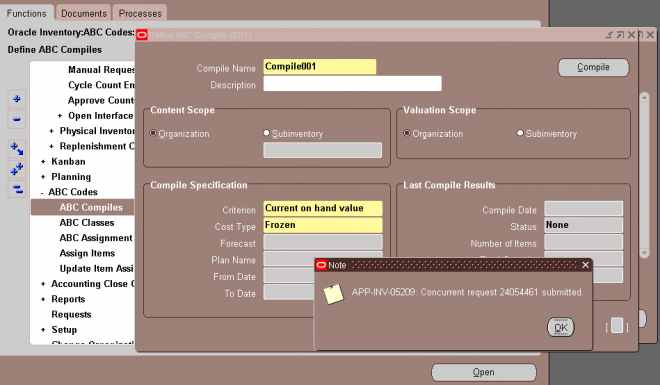
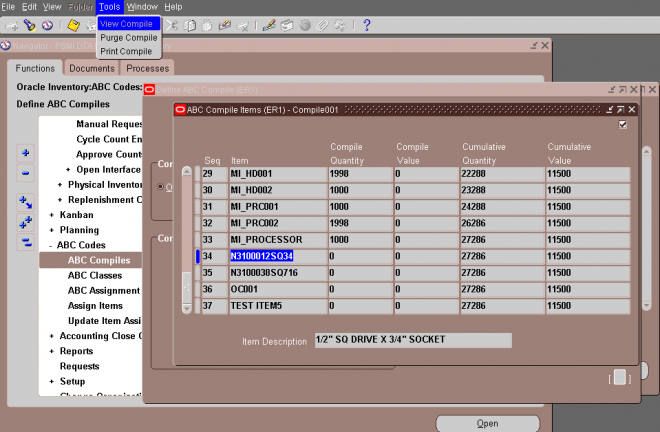
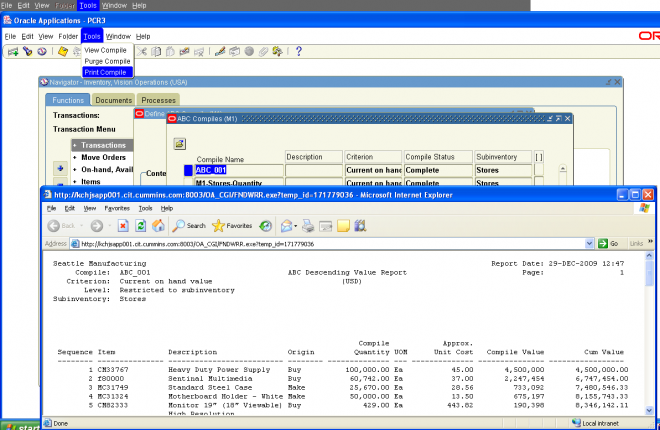
ABC assignment groups link a particular ABC compile with a valid set of ABC classes. This allows you to selectively reduce or increase the number of ABC classes you want to use in your item assignments for a particular ABC compile. For example, you might have five classes, A, B, C, D, and E, defined for your organization where you perform your ABC analysis by subinventory. The first subinventory is rather small. You need only three classes in which to divide your items. You define
an ABC group, associating the ABC compile for the first subinventory with the classes A, B, and C. The second subinventory for which you compile an ABC analysis is much larger. There are five distinct value groupings of items. You define a second ABC group, associating the BC compile for the second subinventory with all five classes defined for your organization, A, B, C, D, and E.
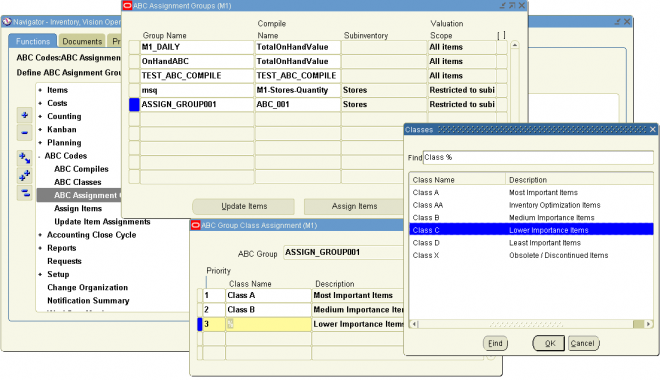
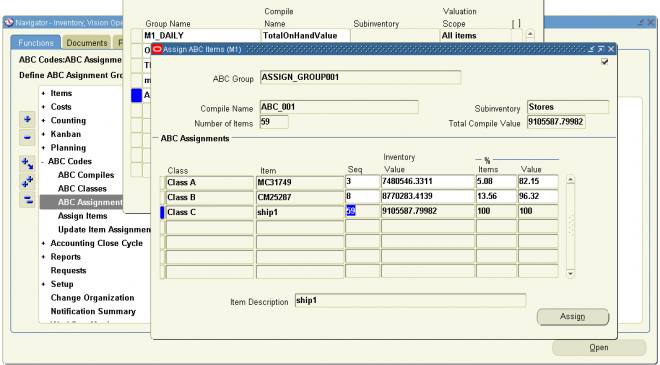
If you are not satisfied with the class into which an item falls as a result of the automatic ABC assignment process, you can change it. For example, assume you compiled your ABC analysis based on historical usage value. You have a relatively new item in your inventory that was ranked toward the bottom of your ABC Descending Value Report since it has very little transaction history on record. Therefore, after the assignment process, this item was assigned to a class of low rank.
However, you know that in the future, this item will have a high usage value and should really be classified as a high rank item. You use the Update ABC Assignments form to reclassify this item to now be a high rank item.
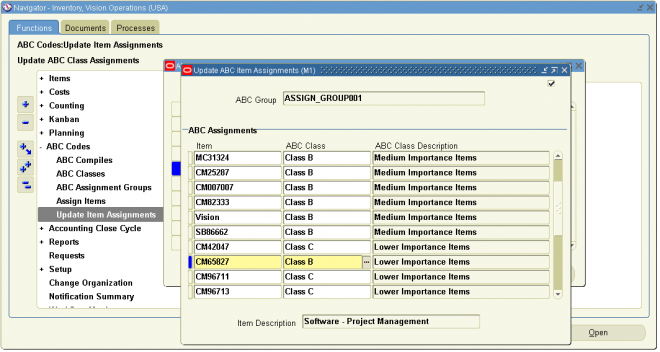
You can submit a request to purge either ABC assignment group or ABC compile information.
Purging an ABC group deletes all item assignments to ABC classes for the assignment group you specify, as well as the ABC group itself. Purging an ABC compile deletes all item values and rankings for the ABC compile you specify, as well as the ABC compile itself. You can purge an ABC compile if no ABC groups are using it.
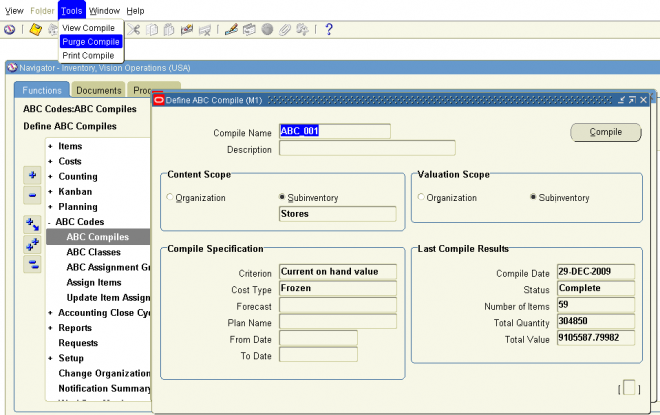
Cycle counting is the periodic counting of individual items throughout the course of the year to ensure the accuracy of inventory quantities and values. Accurate system on–hand quantities are essential for managing supply and demand, maintaining high service levels, and planning production.
You can perform cycle counting instead of taking complete physical inventories, or you can use both techniques side–by–side to verify inventory quantities and values. Inventory supports serialized cycle counting, and the following modules discuss the steps involved.
Defining and Maintaining a Cycle Count
A combination of parameters constitutes a cycle count header, identified by the cycle count name. You use this name to identify any activity pertaining to this cycle count.
You can define and maintain an unlimited number of cycle counts in Oracle Inventory. For example, you can define separate cycle counts representing different sets of subinventories in your warehouse.
Prerequisites
❑ Define ABC classes.
❑ Define your workday calendar.
❑ When determining cycle count classes based on ABC analysis, you must compile an ABC analysis and assign your compiled items’ ABC classes.
To define a new cycle count:
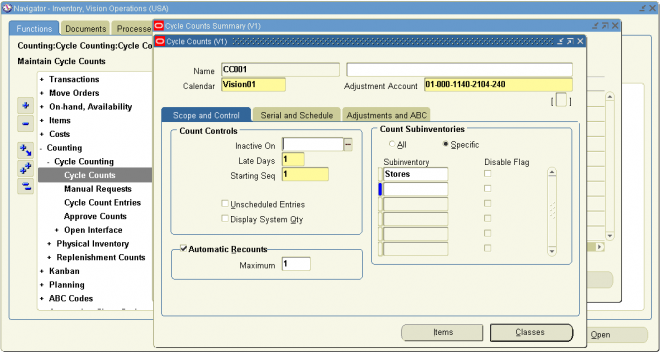
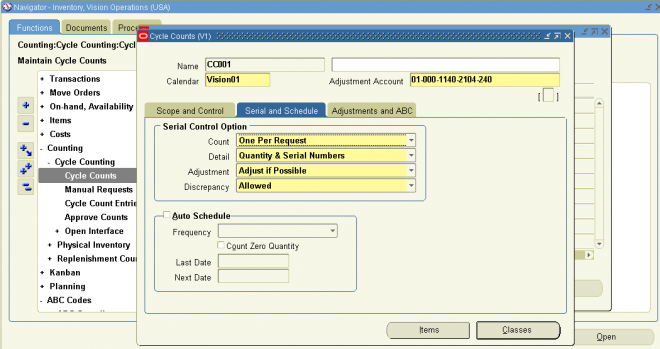
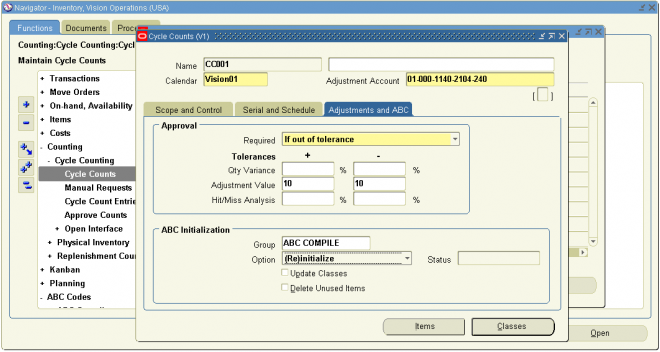
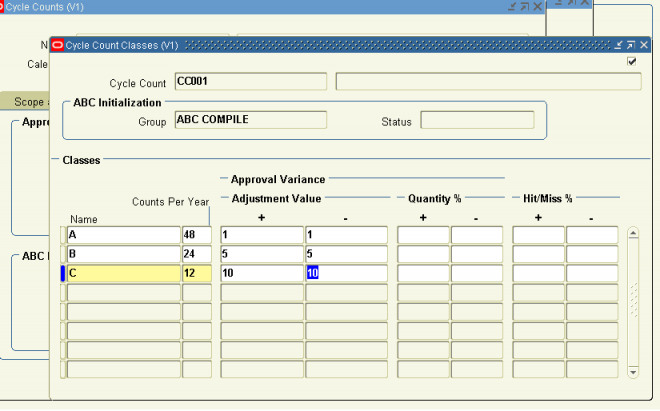
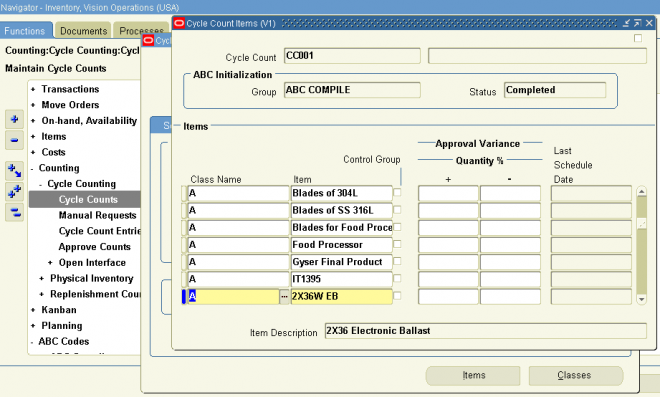
Automatic Scheduling
Oracle Inventory uses the number of items in each cycle count class, the count frequency of each class, and the workday calendar of your organization to determine how many and which items you need to count during the scheduling frequency.
In order for Inventory to perform automatic scheduling you must:


After you have successfully scheduled your counts, you can submit the process to generate count requests. This process takes the output of the automatic scheduler and your manual schedule entries, and generates a count request for each item number, revision, lot number, subinventory, and locator combination for which on–hand quantities exist. These count requests are ordered first by subinventory and locator, then by item, revision, and lot. Oracle Inventory assigns a unique sequence number to each count request that can be used for reporting, querying, and rapid count entry.
Because the count requests are derived from the state of on–hand balances at the time the Generate Cycle Count Requests process is run, you should wait to run it until you are ready to count.
Note: When you schedule an item to be counted using manual scheduling, some schedule requests may have overlapping
count requirements. The count request generator does not create duplicate count requests, but instead cross–references
one count request back to each associated schedule request.
Count Requests for Items with Zero Count
By default Inventory does not automatically generate requests to count items with an on–hand quantity of zero. To include such items:
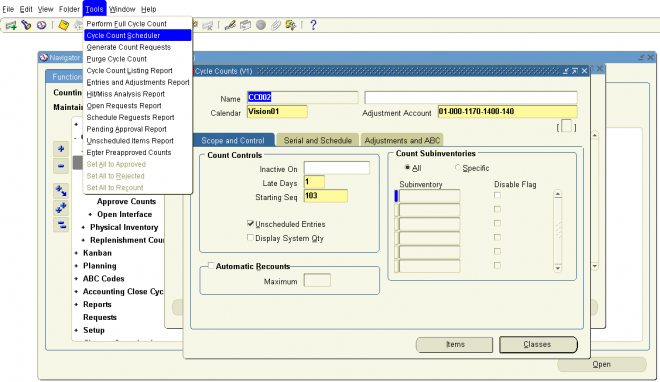
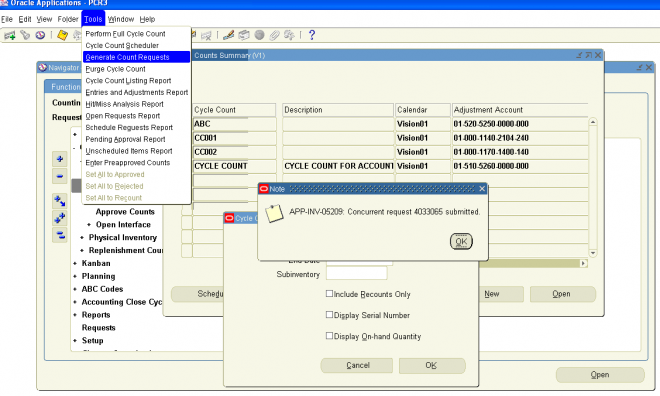
You can use the same window to enter counts of items requested via automatic or manual cycle count scheduling. If unscheduled count entries are allowed for your cycle counts, you can enter those also. Oracle Inventory automatically queries up all count requests for which you have not yet entered a count. You can use flexible search criteria to specify the group of count requests for which you want counts entered to speed up the count entry process. For example, you can specify a range of count request sequences assigned to one person so they can be entered in the same order they were printed on the count sheet.
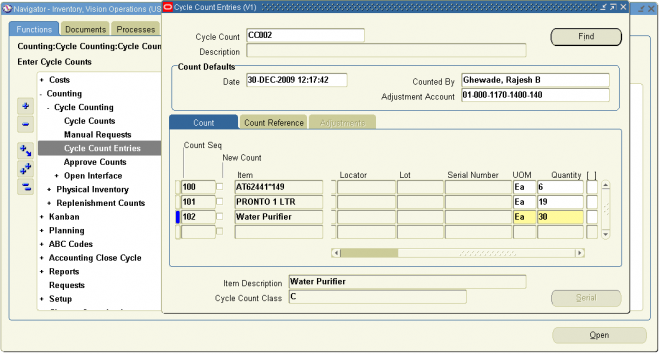
Transfer Price is the price at which an item is transferred from one operating unit to another operating unit. Transfer price is also usually called as “Arm’s length Price” and is generally guided by the originating country’s accounting standards.
Logic for transfer price determination for shipping flows is explained in Figure . However, for procuring flow, you can specify whether the transfer price is same as the PO price in intercompany transaction flow. This means that an operating unit sells at the same price at which it procured the item to another operating unit. If you specify that the transfer price is not same as the PO price in the intercompany transaction flow, then system uses the same logic as depicted in . For procuring flow, you specify the pricing option (transfer price or PO price) separately for asset and expense items.

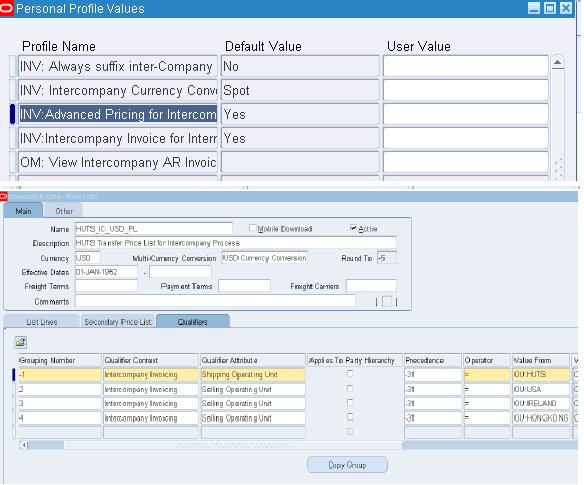
To schedule a discrete job with a routing
Enter or select either the Start or Completion date and time.
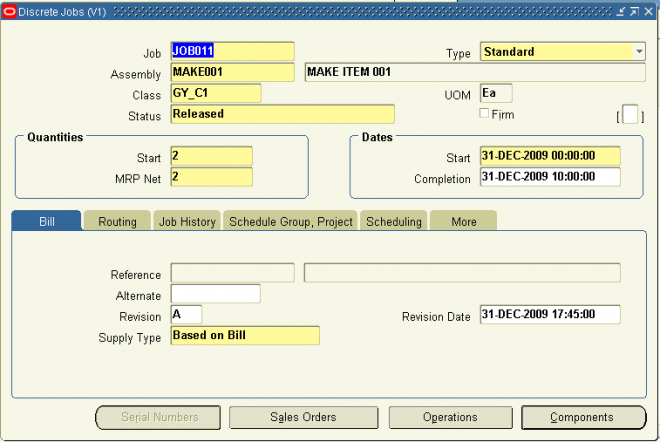
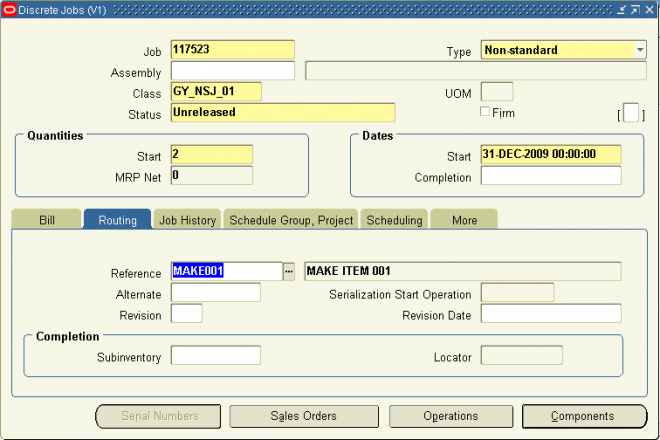
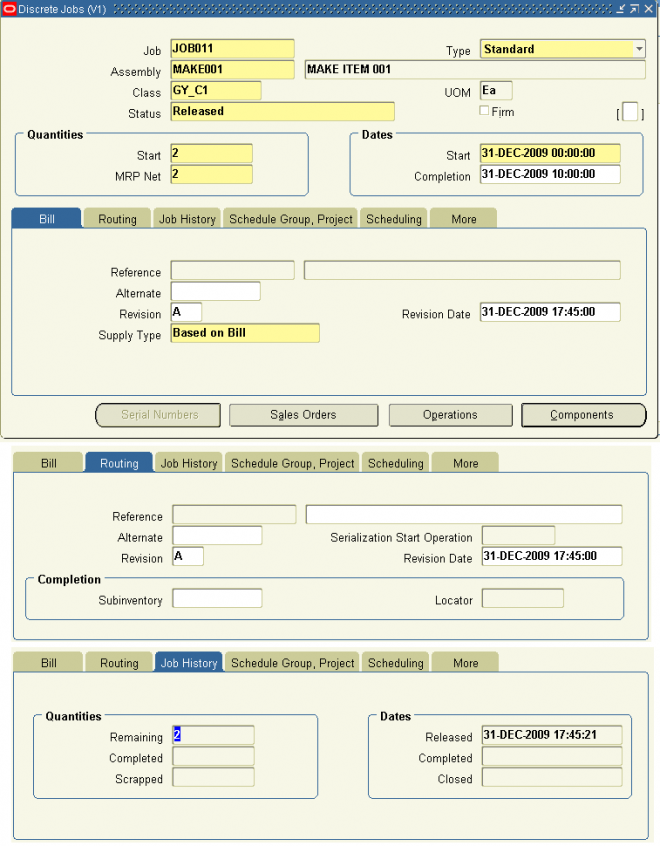
An account alias is an easily recognized name or label representing a general ledger account number. You can view, report, and reserve against an account alias. During a transaction, you can use the account alias instead of an account number to refer to the account.
To define an account alias:
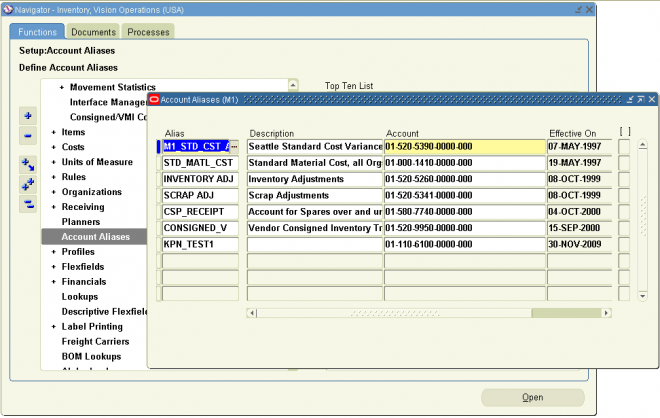
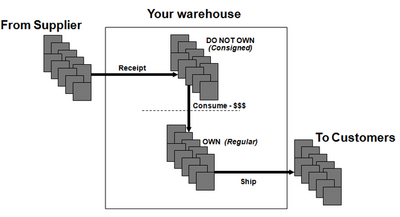 Consignment Inventory is inventory that is in the possession of the customer, but is still owned by the supplier. In other words, the supplier places some of his inventory in his customer’s possession (in their store or warehouse) and allows them to sell or consume directly from his stock. The customer purchases the inventory only after he has resold or consumed it. The key benefit to the customer should be obvious; he does not have to tie up his capital in inventory. This does not mean that there are no inventory carrying costs for the customer; he does still incur costs related to storing and managing the inventory.
From the "Consigned inventory from supplier" User's Guide: Consigned inventory from supplier exists when inventory is in the possession of one party (a dealer, agent, distributor, and so on), but remains the property of another party(such as the manufacturer or primary contractor) by mutual agreement. Consigned inventory from Supplier refers to one type of consigned inventory practice where you receive and maintain goods belonging to one or more of your suppliers. Both suppliers and customers benefit through a consigned inventory strategy:
Consigned VMI with Customers Is defined as the process that allows you to manage inventory at your customer sites (monitoring of on-hand, as well as the replenishment), and to operate a consigned inventory (pay-on-use) scenario where the material ownership remains with you until it is consumed by the customer. Traditionally, this process is highly laborious and transactional oriented and provides little visibility into the customer inventory and demand position. It is prone to stock outs and increased expediting costs. What you want to do is move to a more automated planning and execution process.
Benefits of consignment include:
Supplier:
1. Does not need to store material 2. Reduced delivery costs, less rush orders, transportation efficiencies 3. Material closer to point of sale Buyer
1. Reduced lead time 2. Reduced funds invested 3. Easier access to material
Consignment Inventory Buyer Prospective (With Supplier)
Currently, Purchasing does not allow encumbrance and consignment to be active at the same time (they are mutually exclusive in the same Operating Unit)
Setups
1. Item : Nothing special here, just make sure that the item is stockable and purchasable.
2. Define and assign a Sourcing Rule for this Item :
Create a Sourcing Rule specifying Both a Supplier and Supplier Site. Make sure the supplier site is a valid purchasing site. Assign the sourcing rule to the Default assignment set (as specified in MRP: Default Sourcing Assignment Set).
3. Create a Blanket Agreement (ASL source document)
Create a normal Blanket Agreement specifying pricing for this Item as appropriate.
Take care that the supplier and supplier site used here must be the same as those in the sourcing rule and ASL.
4. Create ASL entry
Take care that you MUST specify a supplier site here otherwise you will not be able to enable consignment for this ASL entry. Also ensure that the supplier and supplier site used here are the same as those in the Blanket Agreement and Sourcing Rule.
Specify the Blanket Agreement number.
If you are unable to select the Blanket Agreement you have created here please check for the following :
A – The Blanket Agreement is not approved
B – The Supplier/Supplier Site combination on the Blanket Agreement is not the same as on the ASL entry
C – The Item on the Blanket Agreement is not the same as on the ASL entry
Now click on the Inventory tab. This is the part of the setup that is different from automatic sourcing.
Make sure to check the ‘Consigned from Supplier’ check box. This is the most important part of the setup.
Business Cycle
1. Create a standard PO
Even though we have created a Blanket Agreement as the source document, consignment requires a PO (and not a Release) to begin the cycle.
Obviously the PO should contain the same Item, Supplier and Supplier Site as those in the Blanket Agreement, Sourcing Rule and ASL.
Approve the PO. Please note that no accounting is expected at this point since encumbrance is disabled (Encumbrance is not compatible with consignment).
2. Receive the Goods
Receive the goods in the destination inventory.
Save the receipt. The goods are now in the specified subinventory. If this was a normal PO, the appropriate accounting transaction would have been created
(Dr Receiving Area account / Cr Inventory AP Accrual account). However, since this is a consigned PO, we do not expect any accounting transaction to have been created.
we can receive the material w/o creating a standard PO and bu just doing a misc. receipt. The owning party should be selected as the supplier.
3. Convert consigned goods to regular goods
Consigned stock is automatically converted to regular stock when certain inventory transactions take place (e.g. shipping), however there is an inventory process that allows consigned stock to be transferred to regular stock (and vice versa). Once consigned stock has been converted to regular stock, the receipt accounting transactions are generated.
To transfer consigned stock to regular stock navigate to Inventory Responsibility->Transactions->Consigned Transactions
Once you specify the Item and Subinventory, the system will check the available and on-hand consigned stock in this subinventory. If you have received the goods correctly then there will be consigned stock which is eligible for transfer to regular stock.
Once this transaction is saved, the item is now regular stock. If you try to create a new transaction the consigned stock will have decreased and if there is no consigned stock left, you will not be able to complete this transaction. Let us now check that the appropriate accounting transaction has been created.
Navigate to Inventory Responsibility->Transactions->Material Transactions form and query the Item.
Goods can also be automatically transferred to regular stock through other means.
From the Oracle Inventory Consigned Inventory from Supplier Process Guide :
The system automatically generates a Transfer to Regular transaction whenever consumption takes place. Consumption transactions are performed either explicitly or implicitly. Explicit consumption is performed whenever the user specifies the external owning party (the consignor) whose goods will be transferred to the internal organization. Explicit consumption is performed by using the consigned transactions window and performing a transfer to regular transaction, or for example, by performing a miscellaneous issue and indicating the owning party in the transaction line. Implicit consumption refers to any type of consumption in which the system automatically determines that consumption is necessary, and selects the owning parties whose stock will be used up to complete the required transaction.
Some transactions always consume consigned materials. These transactions include the following:
Other transactions can be set up to consume according to rules in the Consumption Transaction Setup window—located in Oracle Inventory. These transactions include Subinventory Transfers, Move Orders, Backflush Transfers, and others.
4. Consumption advice
Once the goods have been consumed, the quantities consumed should be communicated to the supplier to provide the necessary information for billing.
Nav: Reports >Consigned Inventory (when you click on this you see a window open for you).
Once you select all the parameters for example Supplier Item, item and Supplier and select go button. you will information below that page and you can drill down that information.This OA framework report it not written in regular Oracle reports.
The normal invoicing and payment cycles and cycle can take place once the supplier has sent the invoice, with the only difference being that invoices are matched to the consumption advice rather than the receipt.
Download the consignment demo from a buyer prospective @
http://www.forum4pmp.com/sites/default/files/consignment_buyer.swf
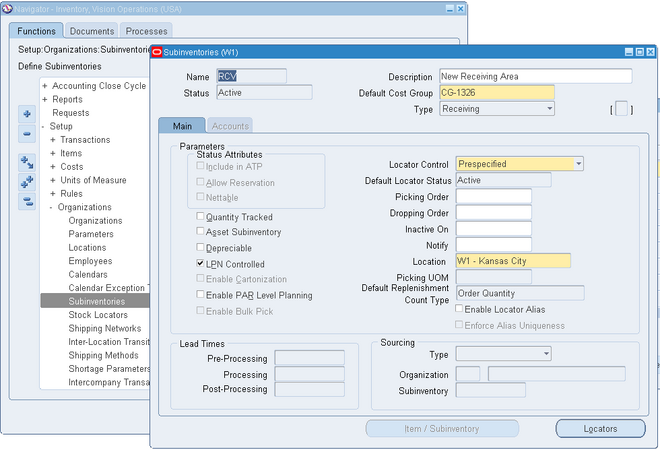
Designates the subinventory as a receiving subinventory, and links it to a receiving location. This subinventory type is used only for receiving material. Material in this type of subinventory cannot be on-hand, or reserved.
You can not enable status attributes (Include in ATP, Allow Reservation, Nettable).
Quantity tracked, Asset Subinventory and Depreciable fields are also not applicable for receiving sub inventory.