WIP Setup
When you log on to the oracle WIP for the first time , you get the below error message
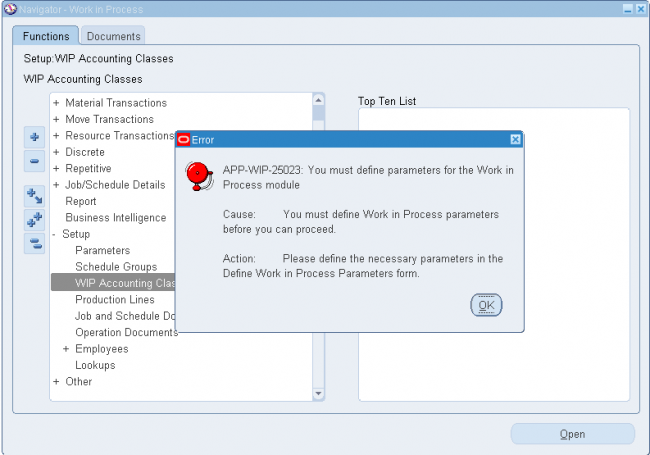
When you log on to the oracle WIP for the first time , you get the below error message
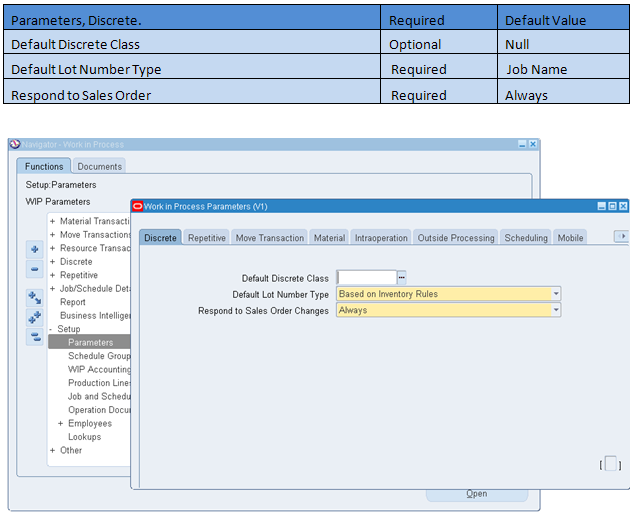
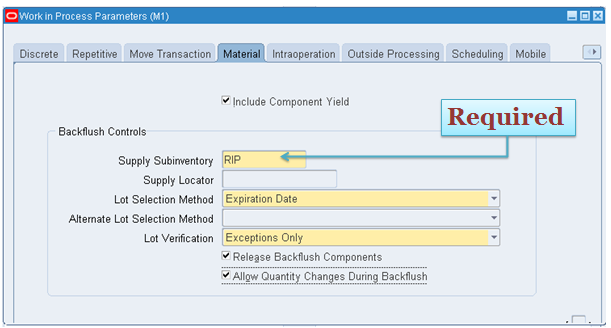
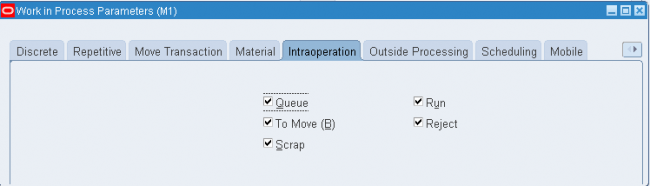
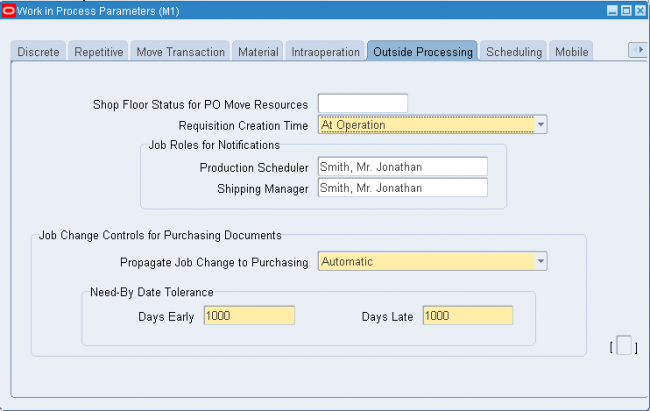
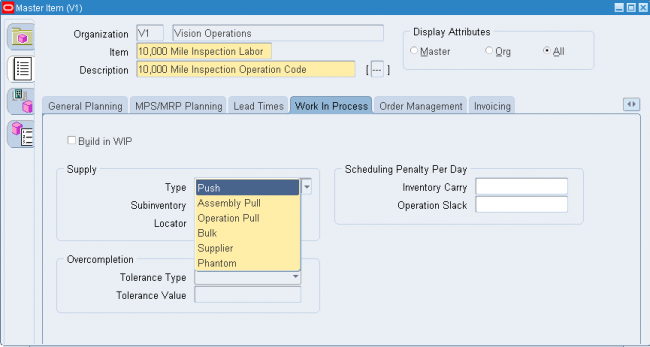
You can use WIP parameters to define modes of operation and to assign default values for various work in process functions. You can only define one set of WIP parameters per organization.
1. Discrete
You can use WIP parameters to define modes of operation and to assign default values for various work in process functions. You can only define one set of WIP parameters per organization.
1. Discrete
You can use WIP parameters to define modes of operation and to assign default values for various work in process functions. You can only define one set of WIP parameters per organization.
1. Discrete
You can use WIP parameters to define modes of operation and to assign default values for various work in process functions. You can only define one set of WIP parameters per organization.
1. Discrete
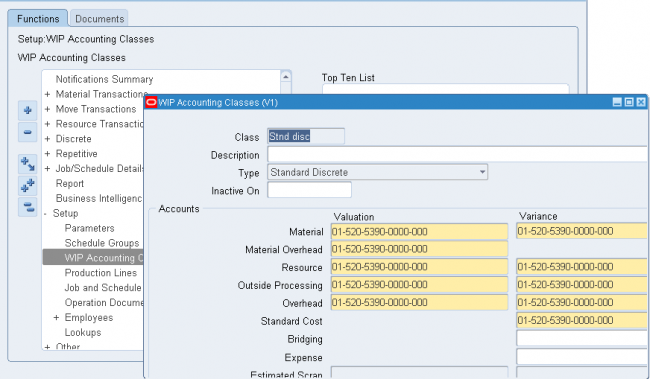
You can define any number of accounting classes. The valuation and variance accounts that are associated with these accounting classes determine which accounts are charged and when.
Discrete Accounting Classes
You can define accounting classes for each type of discrete production you use: standard discrete, asset non-standard discrete and expense non-standard discrete. You must assign an accounting class all your discrete jobs.
Standard Discrete
Standard discrete accounting classes can be used to group job costs. For example, if you build subassemblies and finished goods, you can define your accounting classes so that you can separately value and report the costs associated with subassembly and finishedgoods production. Standard discrete accounting classes can be automatically defaulted when you create discrete jobs.
When you define an accounting class, you must assign valuation and variance accounts to it. When you issue materials to a job that uses this accounting class, the appropriate valuation accounts are charged. When the job is closed, final costs and variances are calculated and posted to the variance and valuation accounts. When the accounting period is closed, these journal entries are automatically posted to the general ledger.
Non-Standard Discrete
Non-standard discrete accounting classes can be used to group and report various types of non-standard production costs, such as field service repair or engineering projects.
For example to track recurring expenses - machine maintenance or engineering projects - with non-standard jobs, you can define and assign an accounting class with a type of expense non-standard to these jobs. The valuation accounts carry the costs incurred on these expense jobs as an asset during the period and automatically writes them off to the variance accounts at period close.
On the other hand, if you use non-standard discrete jobs to track production costs as assets, you can define and assign an accounting class with a type of asset non-standard.
Asset non-standard discrete jobs are costed the same as standard discrete jobs. Valuation accounts are charged when material is issued to a job and final costs and variances are calculated and posted to the appropriate variance and valuation accounts when the job is closed.
You can define any number of accounting classes. The valuation and variance accounts that are associated with these accounting classes determine which accounts are charged and when.
Discrete Accounting Classes
You can define accounting classes for each type of discrete production you use: standard discrete, asset non-standard discrete and expense non-standard discrete. You must assign an accounting class all your discrete jobs.
Standard Discrete
Standard discrete accounting classes can be used to group job costs. For example, if you build subassemblies and finished goods, you can define your accounting classes so that you can separately value and report the costs associated with subassembly and finishedgoods production. Standard discrete accounting classes can be automatically defaulted when you create discrete jobs.
When you define an accounting class, you must assign valuation and variance accounts to it. When you issue materials to a job that uses this accounting class, the appropriate valuation accounts are charged. When the job is closed, final costs and variances are calculated and posted to the variance and valuation accounts. When the accounting period is closed, these journal entries are automatically posted to the general ledger. (Cost -> Valuation A/C, Variance - Variance A/Cs)
Expense Non-Standard Discrete
Non-standard discrete accounting classes can be used to group and report various types of non-standard production costs, such as field service repair or engineering projects.
For example to track recurring expenses - machine maintenance or engineering projects - with non-standard jobs, you can define and assign an accounting class with a type of expense non-standard to these jobs. The valuation accounts carry the costs incurred on these expense jobs as an asset during the period and automatically writes them off to the variance accounts at period close.
Asset non–standard Discrete
On the other hand, if you use non-standard discrete jobs to track production costs as assets, you can define and assign an accounting class with a type of asset non-standard.
Asset non-standard discrete jobs are costed the same as standard discrete jobs. Valuation accounts are charged when material is issued to a job and final costs and variances are calculated and posted to the appropriate variance and valuation accounts when the job is closed.
You can define any number of accounting classes. The valuation and variance accounts that are associated with these accounting classes determine which accounts are charged and when.
Discrete Accounting Classes
You can define accounting classes for each type of discrete production you use: standard discrete, asset non-standard discrete and expense non-standard discrete. You must assign an accounting class all your discrete jobs.
Standard Discrete
Standard discrete accounting classes can be used to group job costs. For example, if you build subassemblies and finished goods, you can define your accounting classes so that you can separately value and report the costs associated with subassembly and finishedgoods production. Standard discrete accounting classes can be automatically defaulted when you create discrete jobs.
When you define an accounting class, you must assign valuation and variance accounts to it. When you issue materials to a job that uses this accounting class, the appropriate valuation accounts are charged. When the job is closed, final costs and variances are calculated and posted to the variance and valuation accounts. When the accounting period is closed, these journal entries are automatically posted to the general ledger.
Non-Standard Discrete
Non-standard discrete accounting classes can be used to group and report various types of non-standard production costs, such as field service repair or engineering projects.
For example to track recurring expenses - machine maintenance or engineering projects - with non-standard jobs, you can define and assign an accounting class with a type of expense non-standard to these jobs. The valuation accounts carry the costs incurred on these expense jobs as an asset during the period and automatically writes them off to the variance accounts at period close.
On the other hand, if you use non-standard discrete jobs to track production costs as assets, you can define and assign an accounting class with a type of asset non-standard.
Asset non-standard discrete jobs are costed the same as standard discrete jobs. Valuation accounts are charged when material is issued to a job and final costs and variances are calculated and posted to the appropriate variance and valuation accounts when the job is closed.
You can define any number of accounting classes. The valuation and variance accounts that are associated with these accounting classes determine which accounts are charged and when.
Discrete Accounting Classes
You can define accounting classes for each type of discrete production you use: standard discrete, asset non-standard discrete and expense non-standard discrete. You must assign an accounting class all your discrete jobs.
Standard Discrete
Standard discrete accounting classes can be used to group job costs. For example, if you build subassemblies and finished goods, you can define your accounting classes so that you can separately value and report the costs associated with subassembly and finishedgoods production. Standard discrete accounting classes can be automatically defaulted when you create discrete jobs.
When you define an accounting class, you must assign valuation and variance accounts to it. When you issue materials to a job that uses this accounting class, the appropriate valuation accounts are charged. When the job is closed, final costs and variances are calculated and posted to the variance and valuation accounts. When the accounting period is closed, these journal entries are automatically posted to the general ledger. (Cost -> Valuation A/C, Variance - Variance A/Cs)
Expense Non-Standard Discrete
Non-standard discrete accounting classes can be used to group and report various types of non-standard production costs, such as field service repair or engineering projects.
For example to track recurring expenses - machine maintenance or engineering projects - with non-standard jobs, you can define and assign an accounting class with a type of expense non-standard to these jobs. The valuation accounts carry the costs incurred on these expense jobs as an asset during the period and automatically writes them off to the variance accounts at period close.
Asset non–standard Discrete
On the other hand, if you use non-standard discrete jobs to track production costs as assets, you can define and assign an accounting class with a type of asset non-standard.
Asset non-standard discrete jobs are costed the same as standard discrete jobs. Valuation accounts are charged when material is issued to a job and final costs and variances are calculated and posted to the appropriate variance and valuation accounts when the job is closed.
Try to understand the screenshots shown in the attched PPT.
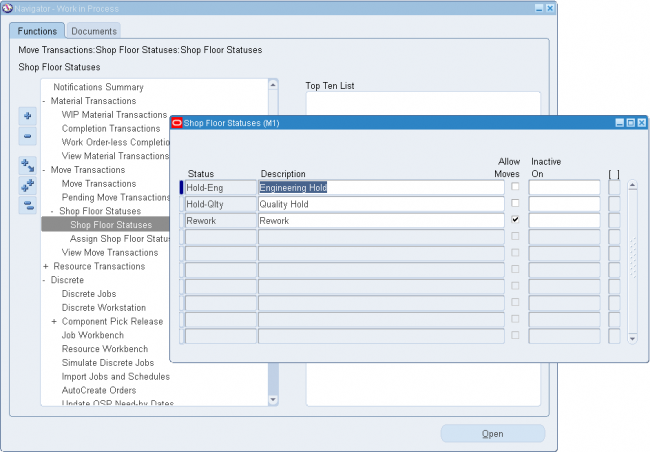
Shop floor statuses can be used to control shop floor movement transactions. You can define as many shop floor statuses as are required. Shop floor statuses can be assigned to the intraoperation steps of work in process routing operations. When assigned to an intraoperation step of an operation that is associated with a particular repetitive line and assembly, the status applies to all repetitive schedules building that assembly on that line.
Usage
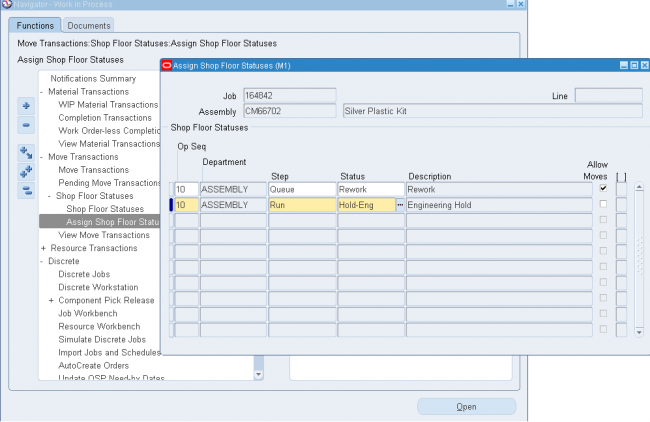
You can control move transactions by assigning Shop Floor Statuses to intraoperation steps on the work in process routing. For example you may want to create a “Hold for Quality Check” status that can be assigned to an intraoperation stepbefore moving to the next assembly step.
Defining Shop Floor Statuses
(N) WIP > Move Transactions > Shop Floor Statuses > Shop Floor Statuses
Shop floor statuses can be used to control shop floor movement transactions. You can define as many shop floor statuses as are required. Shop floor statuses can be assigned to the intraoperation steps of work in process routing operations. When assigned to an intraoperation step of an operation that is associated with a particular repetitive line and assembly, the status applies to all repetitive schedules building that assembly on that line.
Usage
You can control move transactions by assigning Shop Floor Statuses to intraoperation steps on the work in process routing. For example you may want to create a “Hold for Quality Check” status that can be assigned to an intraoperation stepbefore moving to the next assembly step.
Defining Shop Floor Statuses
(N) WIP > Move Transactions > Shop Floor Statuses > Shop Floor Statuses
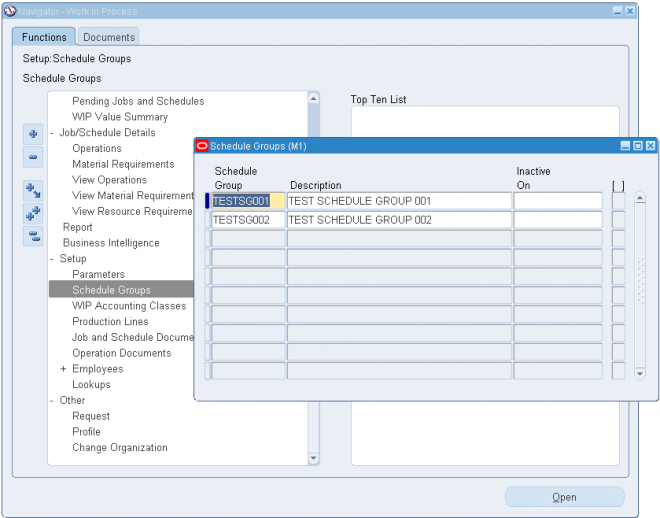
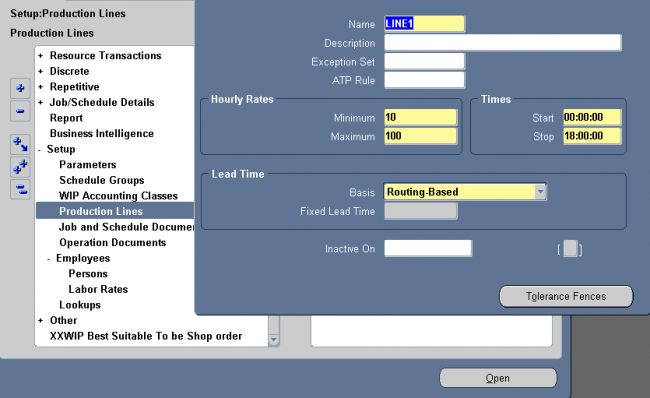
You can define schedule groups then assign them to the jobs that you create. For example, you can define a schedule group then assign that schedule group to a group of jobs that are being built on a specific production line and that must be completed on a specific date for a planned departure.
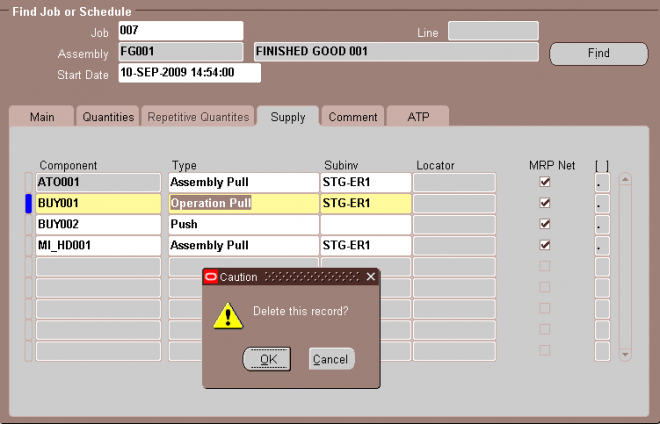
You can update schedule groups. You cannot delete schedule groups that are not assigned to jobs.
Schedule groups are used to group jobs. You can assign schedule groups as you define and update jobs. For example, you can create a Week01 schedule group to identify which jobs are to be released and built during the first week of your current production cycle. Schedule group names can be up to 30 characters and must be unique within the organization.
You can define schedule groups then assign them to the jobs that you create. For example, you can define a schedule group then assign that schedule group to a group of jobs that are being built on a specific production line and that must be completed on a specific date for a planned departure.
You can update schedule groups. You cannot delete schedule groups that are not assigned to jobs.
Schedule groups are used to group jobs. You can assign schedule groups as you define and update jobs. For example, you can create a Week01 schedule group to identify which jobs are to be released and built during the first week of your current production cycle. Schedule group names can be up to 30 characters and must be unique within the organization.
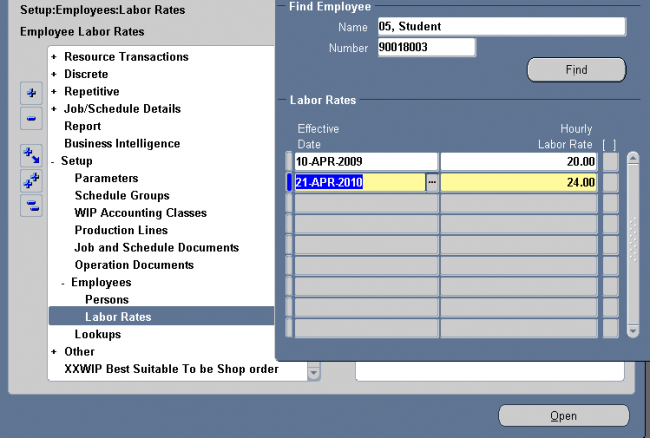
You can add, delete, and update the effective date of the hourly labor rates for person–type resources (employees). You also can define multiple hourly labor rates for the same employee, as long as each rate has a different effective date.
If you use actual costing, the hourly labor rate rather than the standard rate is used to compute the actual cost of person–type resources charged to discrete jobs and repetitive schedules. You can enter an employee number when performing a person–type resource transaction in the Resource Transactions window or the Resource Transaction Open Interface process. The employee’s most current hourly labor rate is used to compute the actual cost of the transaction.
You can use Oracle Work in Process to produce assemblies in discrete batches, also known as discrete jobs.
Standard Versus Non–Standard Jobs
Standard discrete jobs control the material, resources, and operations required to build an assembly and collect its manufacturing cost. Non–standard discrete jobs control material and collect costs for miscellaneous manufacturing activity. They may or may not build an assembly. This type of activity can include rework, field service repair, upgrade, disassembly, maintenance, engineering prototypes, and other projects.
Discrete Versus Lot Based Jobs
A discrete job is a production order for the manufacture of a specific (discrete) quantity of an assembly, using a specific standard routing and operations. If you have Oracle Shop Floor Management installed, you can use lot based jobs in your manufacturing. A lot based job follows a network routing. Network routings provide flexibility in choosing the next operation which, in turn, determines the series of operations the job moves through.
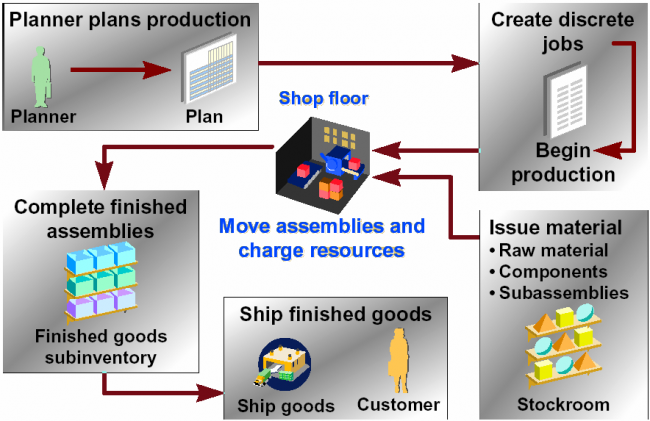

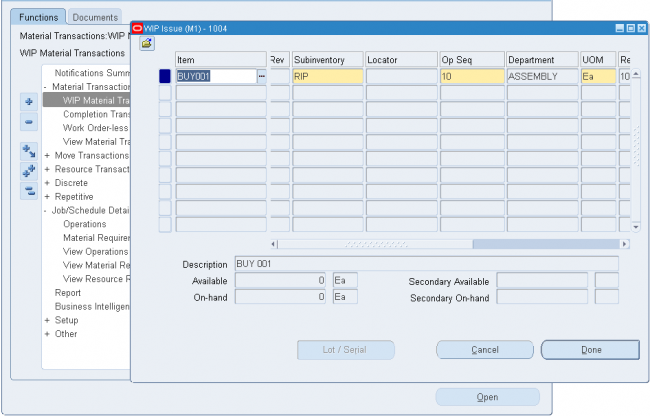
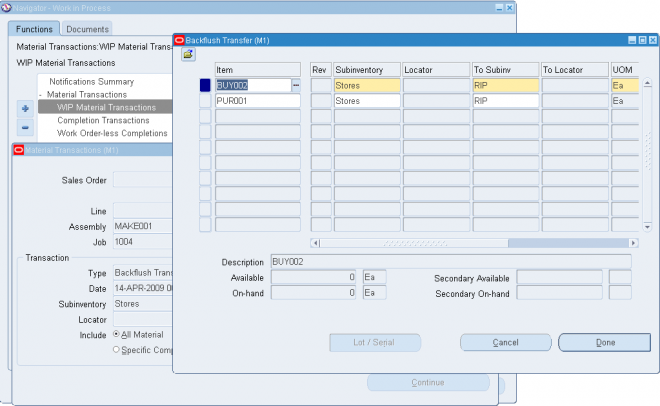
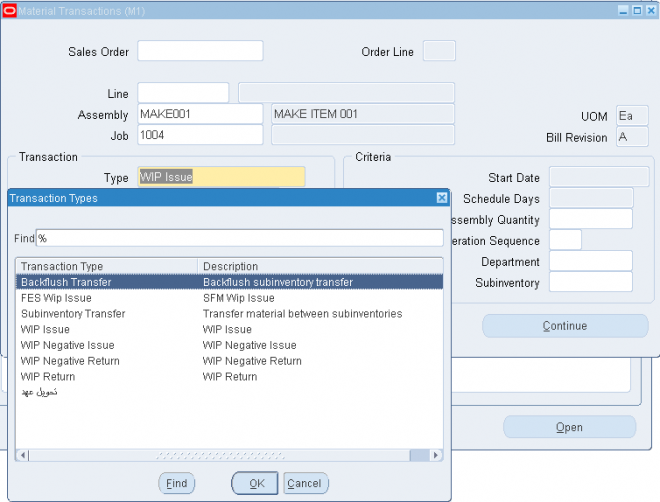
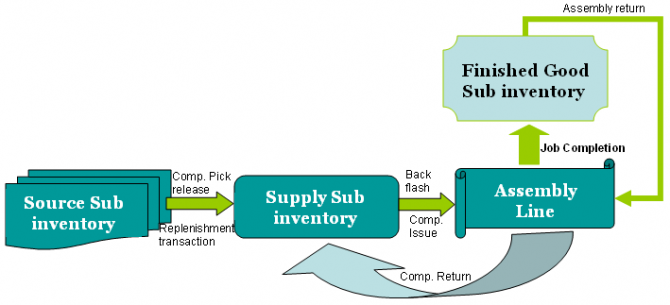
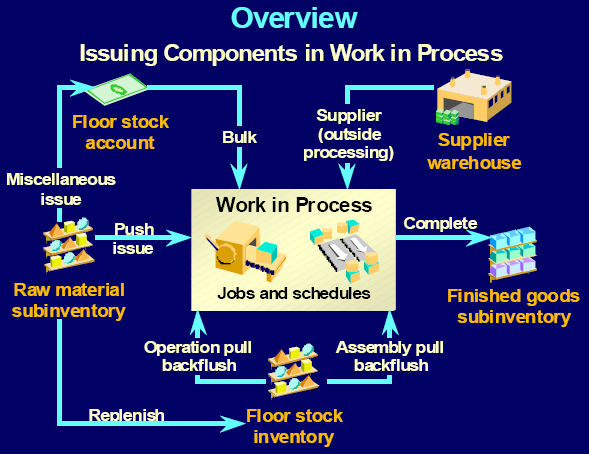
As shown in the below fig. in WIP we mainly do three types of transactions
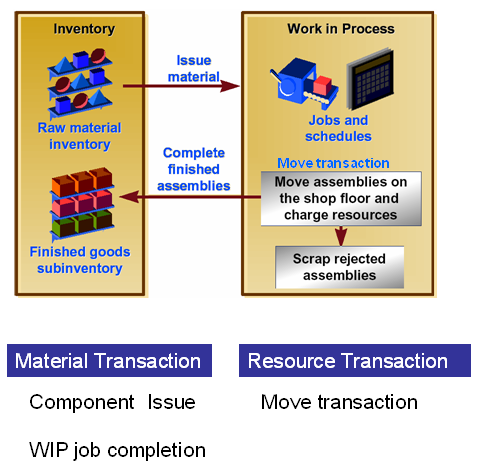
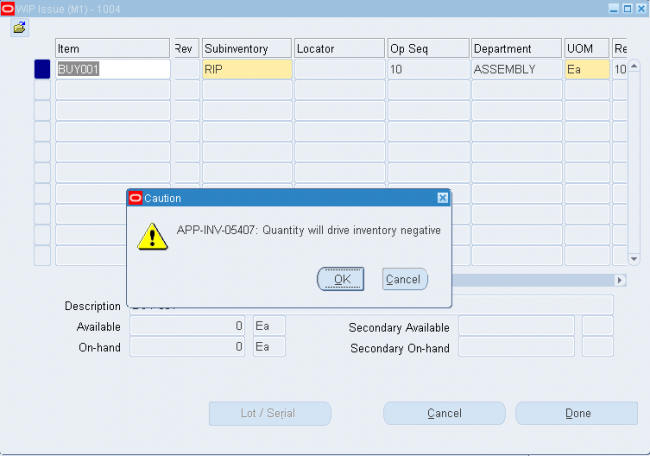
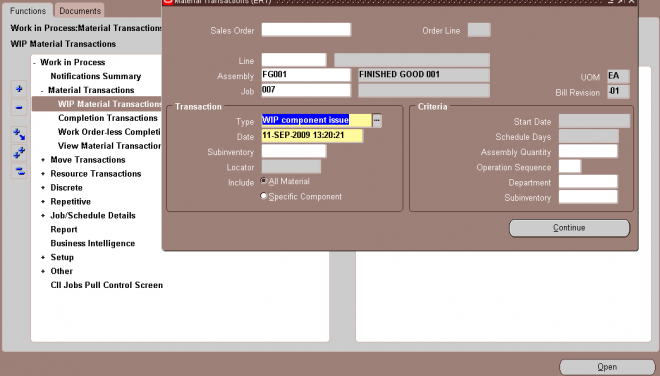
An issue transaction is a material transaction to issue component items from inventory to work in process. Issue transactions:
- Fulfill WIP material requirements on jobs
- Reduces inventory balances and valuation
- Incur WIP costs and increase WIP valuation
- Can be manual or automatic
An example of an automatic issue is a backflush transaction generated from an assembly completion. It automatically issues component items into work in process from inventory. In this section you will see how to do a manual issue transaction, also known as ‘Pushing’ material to a job. Manual issue transactions are required to relieve inventory for items with a WIP supply type of Push.
Copleting the PROCESS
Check the WIP value summary
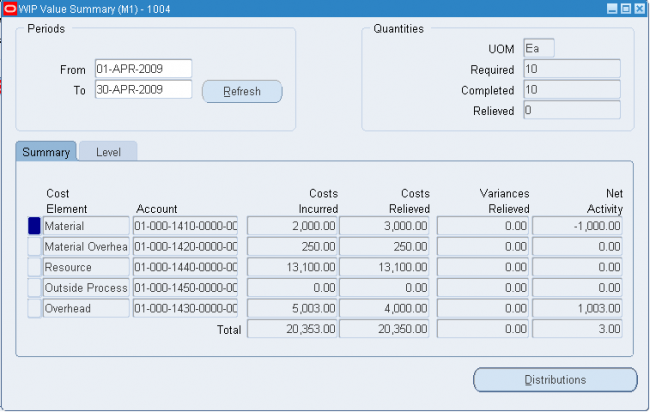
and Finally Close the JOB.

and Veify the WIP Summary Value once again.
Notice that there is not net activity and the difference bewteen costs incurred and costs relieved is taken care by variance a/c.
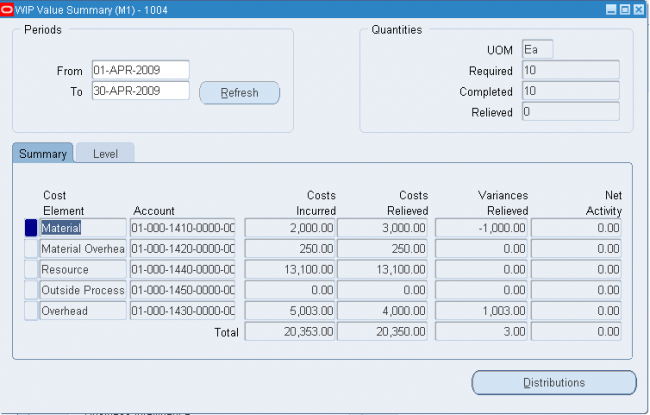
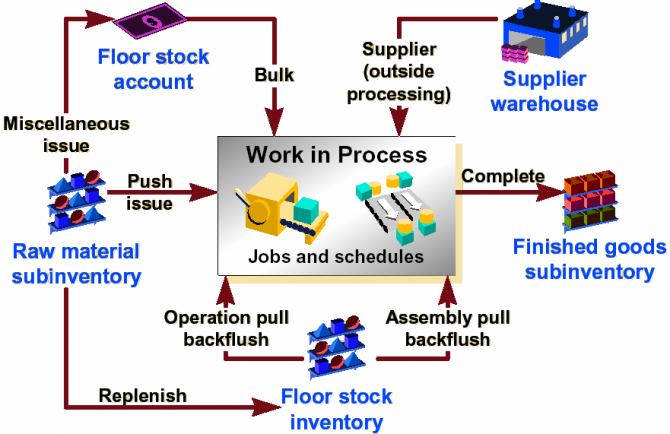
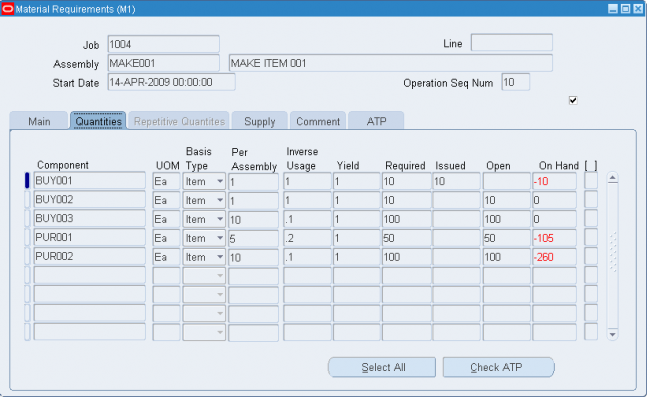
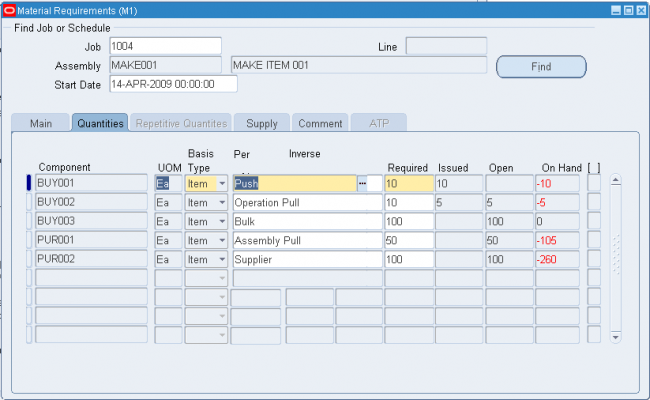
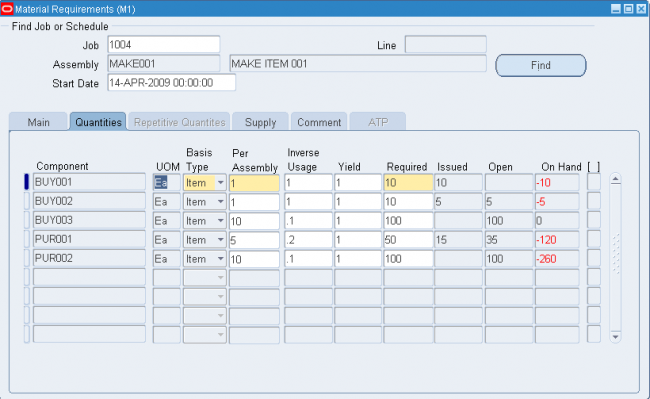
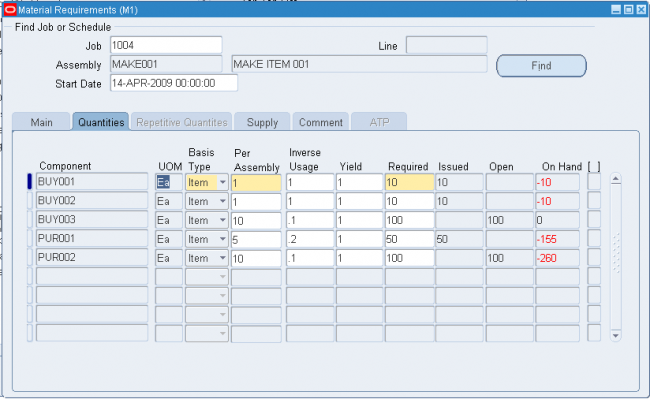
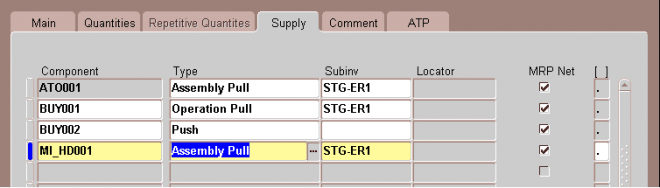
Lets consider the Material cost incurred and relived.
Item Mat.Cost Qty WIP Supply Type
PUR001 - 40 50 Assembly Pull
PUR002 - 10 100 Supplier
Rest of the items has mat cost zero.
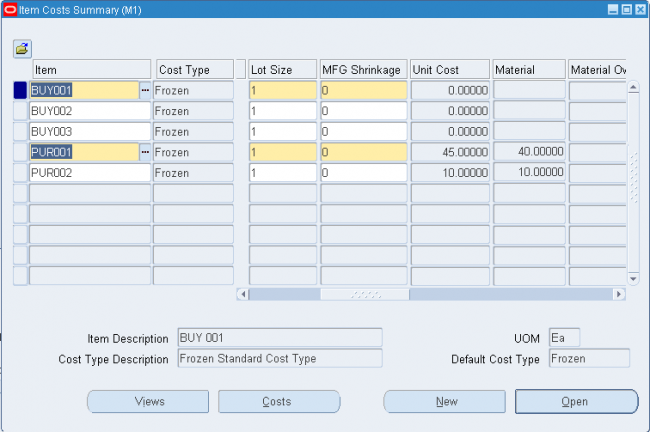
As the item PUR002 has an WIP Supply type of supplier, it is not backflushed or pushed so it wont add any value to the cost of the finished good and a misc issue needs to be done to issue out these materials and that 'll hit the exepense account.
When you enter material transactions in the WIP Material Transactions window you must select one of the following transaction types:
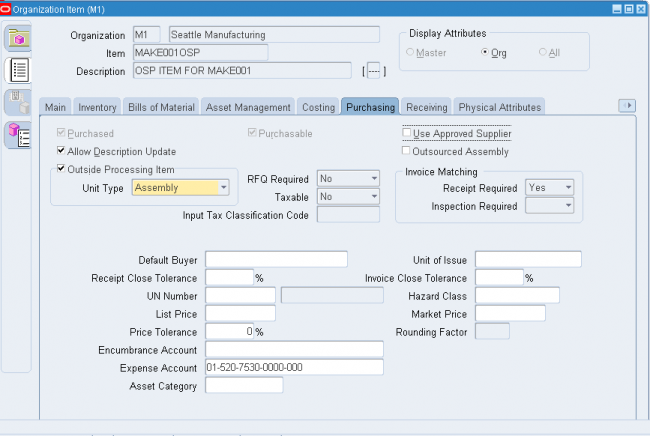
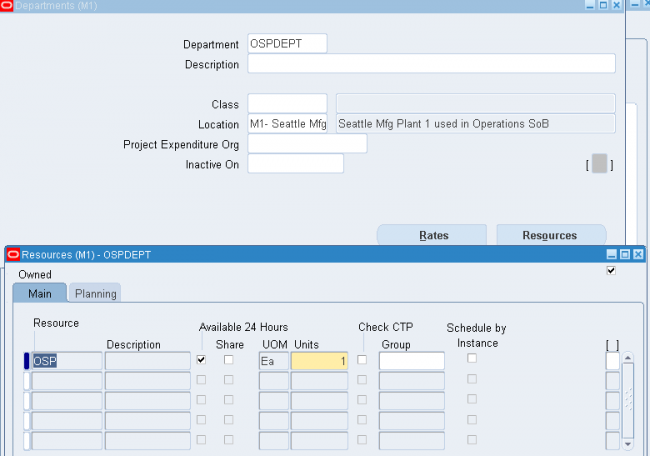
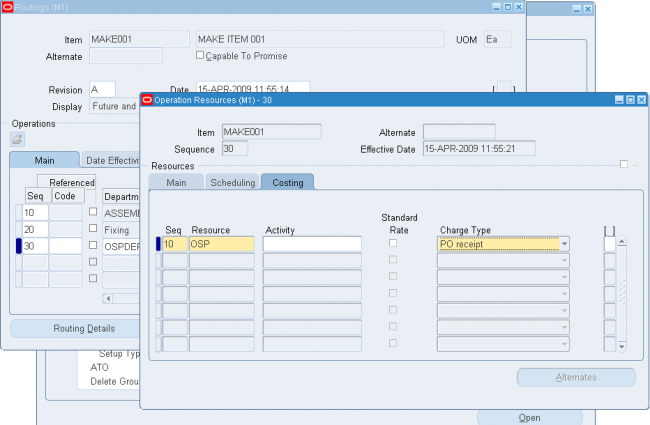
1. Create an OSP Item
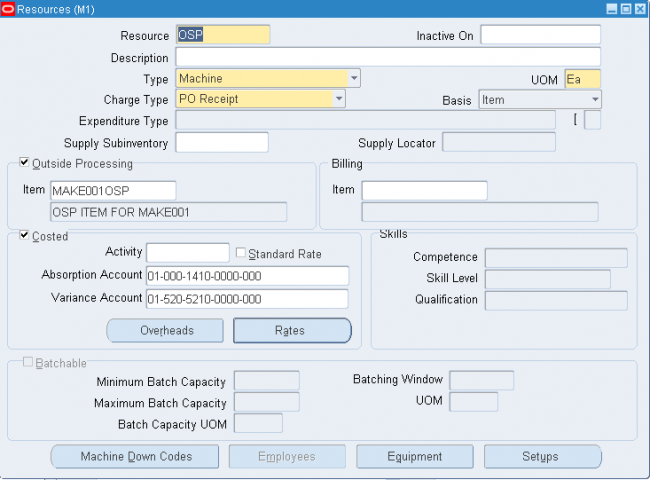
Res Charge
WIP Resource A/C Dr
OSP Resource Abosrption A/C Cr
When you create an OSP resource, Sytsem defaults the receving valuation account as the OSP Resource Abosrption. Dont change the value else your receiving valuation account will have an incorrect balance.
You can create discrete jobs in the following ways:
Planned Discrete Jobs
You can create planned orders and reschedule recommendations using the Planner Workbench in Oracle Master Scheduling/MRP and Oracle Supply Chain Planning. You can modify the due dates and quantities of planned orders, and also firm plan these orders. You can create new discrete jobs by implementing all or some planned orders.
When you create jobs using the Planner Workbench, you can specify the WIP accounting class. Accounting classes can be defaulted. If the job being created is for a lot controlled assembly, the WIP Default Lot Number Type parameter is used to determine whether lot numbers are assigned based on the job name or based on the Oracle Inventory lot number rules.
Discrete jobs created from planned orders use the planned order quantity as the default job quantity. The primary bill of materials and primary routings for the assemblies are used to create work in process bills and routings. Jobs created from planned orders are backward scheduled from the required completion date. The calculated start date is used to determine the bill and routing revisions and revision dates.
Planning takes shrinkage rate, component yield, and safety stock into consideration in the planning process. Once you define the standard job, supply is calculated using the following formula:
available supply quantity = (MRP net quantity – quantity
completed – quantity scrapped) x 1 – item shrinkage rate)
You can also use the Planner Workbench to reschedule existing jobs.
For example, you can reschedule every assembly in the plan or you can reschedule only certain specific assemblies.
When you implement planned orders and create discrete jobs, Planning does not take into account the WIP:View Only Released ECOs profile option in the Personal Profile Values window. Oracle Advanced Planning provides a profile option enabling you to align Work in Process production with engineering changes for planning .
Kanban Replenishments
In a pull–based system, inventory items for a particular part or assembly area are replenished as soon as they are needed. When the items are needed, kanban cards in Oracle Inventory change their Supply Status to Empty, and Inventory generates production kanban replenishment request automatically.
When discrete jobs and repetitive schedules are created in response to kanban replenishment signals, they are automatically loaded into the Work Order Interface and automatically processed. If the replenishment signal creates a discrete job, the kanban card is referenced on that job; however, if the replenishment signal creates a repetitive schedule, the kanban card is not referenced. Once the discrete job or repetitive schedule has been successfully loaded, the status of the kanban card is updated to In process.
When kanban replenishment jobs and schedules fail validation and processing, they are automatically deleted from the interface table. The reason for their failure is noted on the Job and Schedule Interface report, which is automatically printed each time the Mass Load program is run. When imported, non–kanban job and schedule information that fails validation or processing is marked. You can use the Pending Jobs and Schedules window to view, update, and resubmit this information.
Final Assembly Orders
You can automatically create final assembly orders for Assemble to Order (ATO) items entered in Oracle Order Management. These discrete job orders are created on a single job to single sales order delivery basis.
On the Sales Order window (which you open from the Discrete Jobs window in Work in Process), you also can associate discrete jobs for both standard items and ATO items with sales orders and thereby allocate production to specific customers. To determine the job start date, you schedule jobs created from final assembly orders backwards from the order due date. The calculated start date is used to determine the bill and routing revisions and revision dates.
Work Order Interface
You can load planned orders, planned order update recommendations, and suggested repetitive schedules from any source — planning systems, order entry systems, finite scheduling packages, production line sequencing programs, spreadsheets, and even custom entry forms
— into the Work Order Interface. For example, if your plant directly feeds to your customer’s plant, you can take demands directly from your customer rather than waiting for the next MRP run thus reducing response time and eliminating unnecessary overhead.
You then use the Import Jobs and Schedules window to launch the WIP Mass Load program, which validates records in the Work Order Interface table and implements any imported records as new discrete jobs, updated discrete jobs, or pending repetitive schedules.
WIP Accounting Class Defaults
You can set up default WIP accounting classes at several levels:
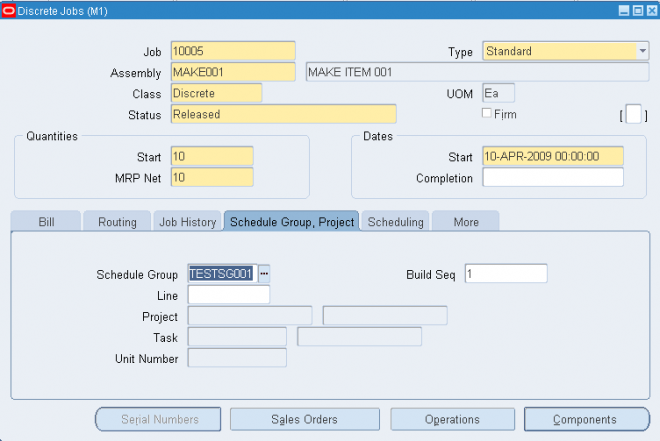
You can manually define standard, non–standard, and project jobs. You can assign bills and routings to standard discrete jobs to create material requirements, schedule operations, and create resource requirements.
You can optionally assign alternate bills of material and/or alternate routings when you define standard discrete jobs (however, neither bills of material nor routings are required). You also can assign bill of material references and/or routing references to non–standard discrete jobs to create material requirements, schedule operations, and create resource requirements.
Further, you can attach illustrative or explanatory files (in the form of text, images, word processing documents, spreadsheets, video, and so on) to discrete jobs.
After saving a job, use the Component and Operations buttons to immediately view the details of the job, including its material requirements, operations, and operation material and resource requirements.
Default job names can only be automatically generated by the automatic sequence generator if a prefix has been specified for the WIP:Discrete Job Prefix profile option.
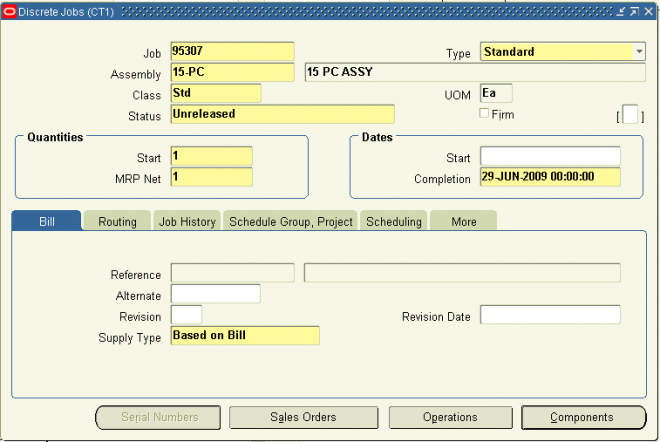
1. Enter or generate the Job name.
You can generate a default Job name by choosing Apply Default Job Name from the Tools menu or by simply pressing the tab key. If you do enter the job name, it must be unique and alphanumeric.
2. Select the job Type, either Standard or Non–Standard.
3. If defining a standard discrete job, select the job Assembly. The assembly is the item you are building. If a primary bill of
material, primary routing, or both exist for this assembly, they are defaulted.
You cannot select an assembly that has a primary routing that is Flow related. If you do, a warning is displayed and you are prompted to enter another routing designator.
Assemblies are optional for non–standard discrete jobs, however, you must enter them for non–standard discrete jobs with routings if you want to track shop floor move and resource transactions.
4. Select the accounting Class.
If a default discrete WIP accounting class can be found, it is used. For non–standard jobs, you can select any active Asset
Non–standard or Expense Non–standard accounting class.
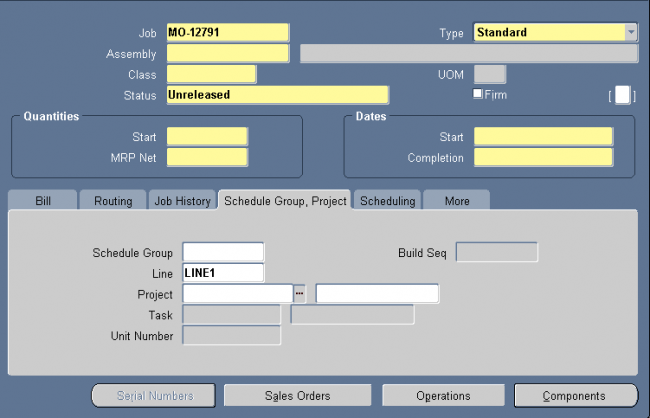
5. Select the job Status.
When you define a job, its status defaults to Unreleased but can be changed to Released or On Hold.
Check the Firm check box to firm your job. You cannot firm a non–standard discrete job.
Firming a discrete job prevents MRP from suggesting rescheduling and replanning recommendations when changes to supply or demand occur. If replanning is required, the MRP planning process creates new jobs to cover the new demand.
6. Enter the job Start quantity.
Standard discrete jobs must have a start quantity greater than zero. When you enter a start quantity for jobs with bills and routings, the component material requirements, department schedules, resource load, and job start and end dates are all determined automatically.
For non–standard jobs, if you enter a start quantity of 0 and specify a bill of material reference, the corresponding bill is exploded but material requirements equal to 0 are created. To perform move and completion transactions for a non–standard job, the start quantity must be greater than zero.
Enter the MRP Net quantity.
The MRP net quantity is the number of assemblies that MRP considers as supply on the scheduled completion date.
For standard and non–standard discrete jobs with assemblies, the MRP net quantity is derived from the job start quantity. For non–standard discrete jobs without assemblies, the default is zero.
The following information provides you with a description of each Work in Process profile option and its values.
TP: WIP: Concurrent Message Level
Determines the level of detail reported in the move transaction concurrent log file during move transaction validation and processing. Available values are listed below:
Reports errors only.
Reports processing activities and errors.
Reports and time stamps processing activities and errors.
TP:WIP:Completion Transactions First Field
Determines which field the cursor defaults to when you first enter the Completion Transactions window. Set this option based on your predominant manufacturing environment: assemble–to–order, project or discrete job, or repetitive.
The available first field values are Line, Assembly, Job, or Sales Order.
You can navigate to another field to override the default.
Attention: You can only enter a Sales Order name if you have an ATO sales order linked to a job.
TP: WIP: Move Transactions First Field
Determines which field the cursor defaults to when you first enter the Move Transactions window. Set this option based on your predominant manufacturing environment: assemble–to–order, project or discrete job, or repetitive.
The available first field values are Line, Assembly, Job, or Sales Order.
You can navigate to another field to override the default.
Attention: You can only enter a Sales Order name if you have an ATO sales order linked to a job.
TP: WIP: Move Transaction Quantity Default
Indicates if and how move transaction quantities are defaulted.
Available values are listed below:
None : No transaction quantity is defaulted.
Minimum Transfer Quantity : When you perform a move transaction, the transaction quantity defaults to the minimum
transfer quantity if the minimum transfer quantity is less than or equal to the available quantity. If the minimum transfer quantity is greater that the available quantity, and the available quantity is not zero, then the available quantity is defaulted.
Available Quantity : When you perform a move transaction, if the available quantity is not zero, the transaction quantity defaults to the available quantity
TP: WIP: Work Order–less Default Completion
Determines the default for the Scheduled flag in the Work Order–less Completions window. Set this profile according to your business requirements. The default can be overridden. Available values are listed below:
Scheduled: The Schedule flag defaults to checked. Use this option if most of your work order–less completions are based upon flow schedules generated by the Line Scheduling Workbench.
Unscheduled: The Scheduled flag defaults to unchecked. Use this option if most of your work order–less completions
are manually entered and not based upon flow schedules generated by the Line Scheduling Workbench.
WIP: Default Job Start Date
Determines whether the start dates for jobs default to the current date and time or not at all when defining jobs in the Discrete Jobs window. The options are Yes or No.
WIP: Discrete Job Prefix
Specifies the job prefix to use when autogenerating job names in the Discrete Jobs, Simulate Discrete Jobs, Import Jobs and Schedules, and AutoCreate windows in Work in Process, and in the Planner Workbench window in Oracle Master Scheduling/MRP and Oracle Supply Chain Planning. It is also used when autogenerating the numbers for flow schedules created in the Work Order–less Completions window.
Work in Process concatenates this prefix with a value from the sequence WIP_JOB_NUMBER_S to create a default discrete job name.
WIP:Enable Outside Processing Workflows
Determines whether or not outside processing workflows are enabled.
Yes: All outside processing workflows are enabled.
No: outside processing workflows are enabled.
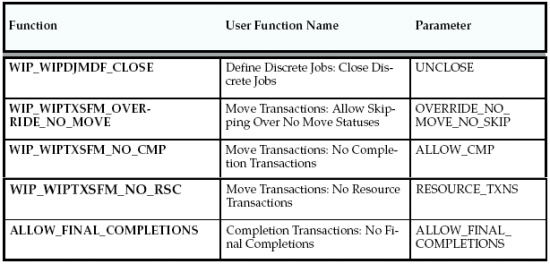
Function security is the mechanism by which user access to applications functionality is controlled. System administrators
administer function security.
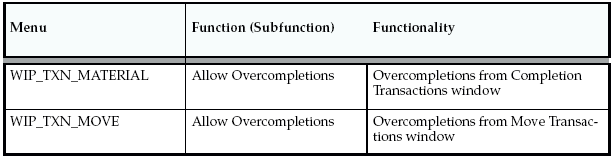
Access to Work in Process functionality is controlled either by menus and form functions/subfunctions or by form function parameters.
Form Function Parameters
Some Work in Process forms are coded to accept particular parameters.
Parameters can be used to limit access to form elements such as:
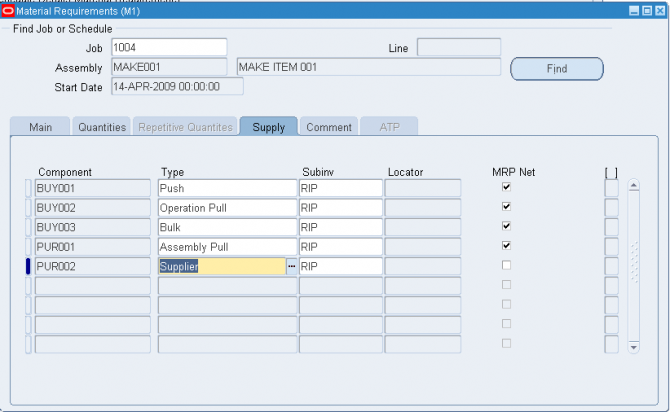
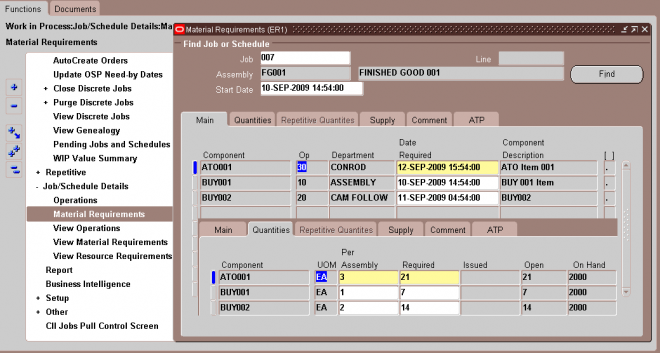
You can control and monitor which materials are used and how they flow from inventory to discrete jobs and repetitive schedules and from jobs and schedules to inventory.
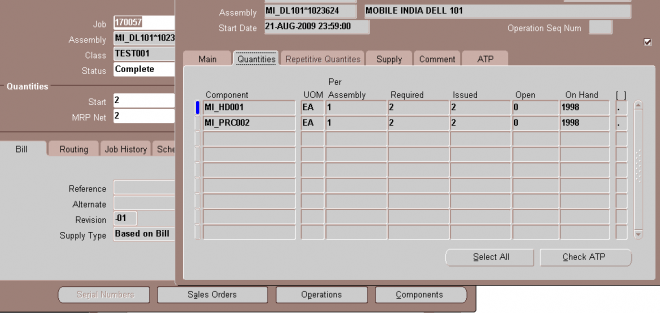
You can add material requirements to discrete jobs and repetitive schedules with statuses of Unreleased, Released, On Hold, and Complete.
Note: You can also add material requirements to jobs and schedules by issuing components not required by the job or
schedule.
To add or update material requirements Navigate to the Material Requirements window.
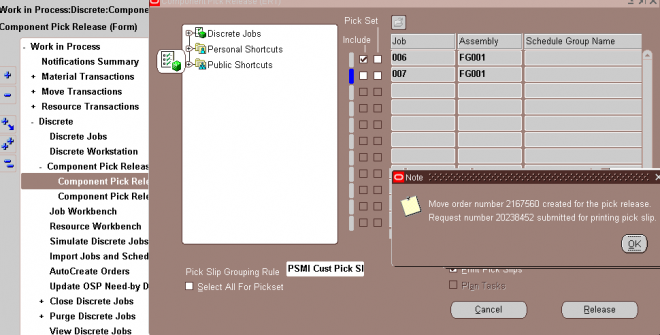
Component picking, obtaining requirements for specific jobs and schedules, is the process of moving items from source locations and issuing them to work orders. In previous versions of Oracle Work in Process, items were issued from locations specified for each component on the bill of material. Now you can also use a rules based system to determine a recommended source location for each component. The features for component picking include:
You can issue components from inventory to jobs and repetitive schedules and return issued components from jobs and schedules to inventory using the WIP Material Transactions window. There are two issue and return options available from this window: All Material and Specific Component.
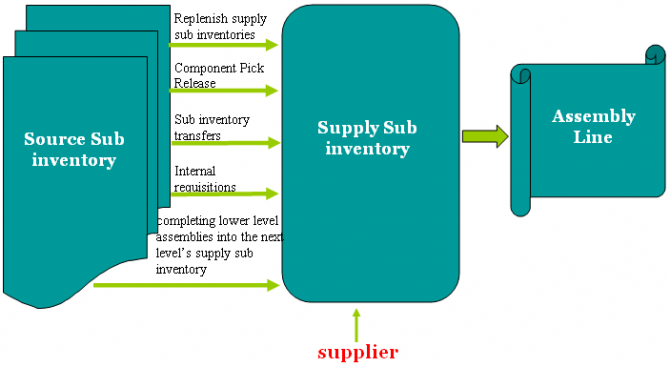
You can replenish supply subinventories and locators to replace components that you have issued to jobs or repetitive schedules and to insure a source of material for backflush transactions. You can replenish components for an entire job or repetitive schedule, or for a specified number of days of repetitive production. Specifically you can do the following:
Backflush transactions ’pull’ components with Operation Pull and Assembly Pull supply types from inventory onto jobs and repetitive schedules. Backflush transactions can be launched by:
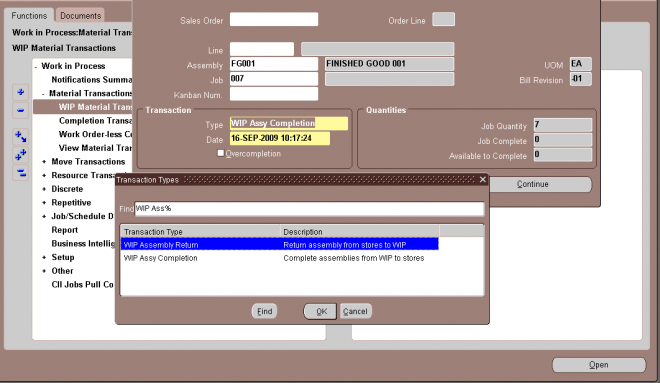
You can complete assemblies from Discrete jobs and Repetitive schedules into inventory, and you can return completed assemblies from inventory to jobs and repetitive schedules. You also can complete a greater quantity than the job or schedule start quantity (over–complete) into inventory, as long as it is within the tolerance level set. Further, on Repetitive schedules and non–standard Discrete jobs, you also can return more assemblies than were completed.
Assemblies can be completed and returned using the Completion Transactions and the Move Transactions windows. You can also import assembly completion and return transactions through the Inventory Transaction Interface in Oracle Inventory.
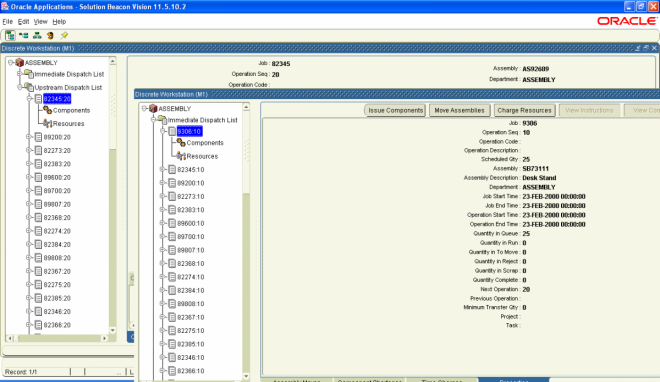
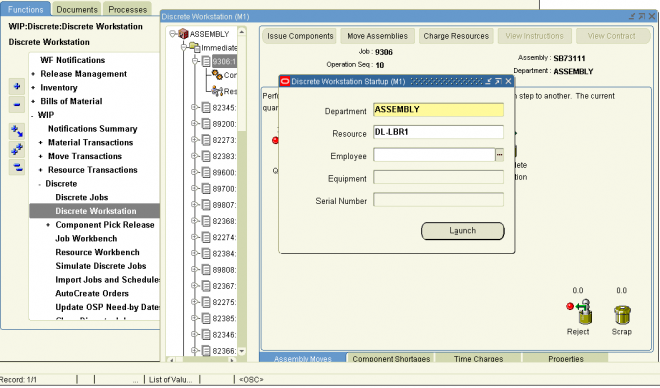
The Discrete Workstation provides you with a single window to obtain critical production information and perform common shop floor transactions. The workstation displays information by department or for a resource, and it lists all of the job operations for immediate and future dispatch at that department or resource.
You can view broad information, such as the utilization, efficiency, productivity, and load on the resources within a department or on a specific resource across all departments. You also can obtain detailed component and resource information on each individual job scheduled for the department or resource. You can perform move, completion, and other common transactions directly on the workstation’s tabs, or open their corresponding Work in Process windows directly from the workstation. There is also a link to Oracle Project Contracts records associated with specific jobs.
The Discrete Workstation can record and track discrete production in organizations enabled for Oracle Shopfloor Management. You can use all the capabilities of monitoring and transaction work on discrete jobs in a mixed mode organization where discrete and lot based jobs are both used.
The Discrete Workstation window is composed of two panes. The left pane displays the navigational tree. The right pane displays one or more tabs of detailed information that correspond to the branch or tab that you select from the tree.
Oracle Work in Process provides a complete cost system to track and report your production costs.
WIP Accounting Classes
You use WIP accounting classes to establish your valuation and variance accounts. You can enter different accounts for each cost element within a WIP accounting class for maximum elemental account visibility. You can also enter the same account for more than one cost element. If you are assign the same account to more than one cost element, you can choose to have the values of these cost elements summarized before being transferred to General Ledger.
Multiple Cost Elements
Through the multiple cost elements (material, material overhead, resource, outside processing, and overhead) that you assign to your accounting classes, the system can track all your production costs to the correct valuation and variance accounts.
Costing Methods
All Oracle costing methods support Oracle Work in Process. However, you can only cost repetitive schedules using standard costs.
Job Costs
You can cost standard and non–standard asset discrete production by job. You can report job costs on a period–to–date and cumulative–to–date basis.
Project Costs
If you are using Oracle Project Manufacturing Costing, you can cost jobs by project. Project jobs can be specific to a single contract or a group of contracts for a specific customer.
Period Costs
You can cost and report your repetitive and non–standard expense production by period.
Repetitive Assembly and Line Costs
You can track your repetitive production costs by assembly on a line so you do not have to review your costs by individual repetitive schedule. You can also track repetitive costs by assembly across lines or by line so you can compare costs for your production lines.
Transaction Based Costs
You can track and report costs through the various stages of production. The system calculates all costs and reports move, issue, resource, overhead, completion, scrap, period close, and job close transaction costs.
Resource Charging
You can charge resources automatically or manually.
Overhead Charging
You can charge overhead automatically based on resource value charges, resource charges, or operation completions.
Fixed and Variable Resource, Outside Processing and Overhead Charging You can set up resources, outside processing, and overheads with a basis of Lot for fixed charges per job or schedule, such as setup and teardown. You can use a basis of Item for resources, outside processing, and overheads that vary based on the job or repetitive schedule quantity.
Flexible Resource, Outside Processing, and Overhead Absorption You can assign separate absorption accounts by sub–element, such as individual resources, outside processing resources, and overheads. As you charge resources, outside processing, and overheads, work in process valuation automatically absorbs your payroll, accounts payable accruals, and overhead cost pools. At period end, you can compare absorbed amounts with actual costs incurred in your general ledger
cost pools and accounts.
Actual Labor Charging
You can charge resources at standard resource rates, standard employee rates, or actual rates.
Actual Purchase Price Charging
You can charge outside resources at predefined or actual purchase prices.
Period Close
When you close an accounting period, period close costs are calculated. The system costs and transfers all production costs by account to Oracle Financial products. You can transfer in summary and detail depending on your Oracle Inventory option.
Variances You can track and report previous level usage variances for materials and this level efficiency variances for resources and overheads. The system calculates standard cost adjustment variances when the standard cost update is run.
Valuation Reporting The system can provides complete valuation reporting including current balances, period to date charges, and cumulative to date charges. You can also report your work in process balances by cost element and level.
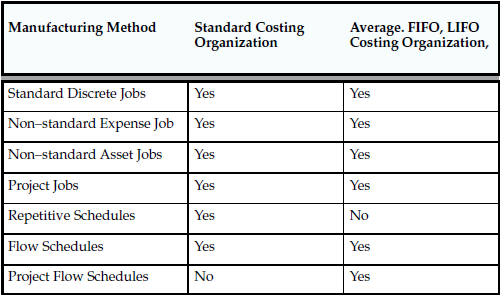
You use standard and non–standard discrete jobs, project jobs, repetitive schedules, and flow schedules to collect the costs of production. For standard and non–standard discrete jobs, you value and report work in process costs based on jobs. For project jobs, you value work in process costs based on the projects that jobs are associated with. For repetitive schedules, you value and report work in process costs based on assemblies on a line in a period, not on specific repetitive schedules.
You can cost standard discrete jobs, non standard discrete jobs, project jobs, and flow schedules in average costing organizations. You can cost repetitive schedules in standard costing organizations only. Costing methods are assigned in the Organization Parameters window in Oracle Inventory.
The following cost transactions can occur when Oracle Work in Process is installed:
WIP supports four resource autocharging methods: Manual,WIP Move,PO Move,and PO Receipt.You can charge resources at an actual rate. You can also charge resource overheads automatically as you charge resources.
WIP Move Resource Charges
You can automatically charge resources at their standard rate to a job or repetitive schedule when you perform a move transaction using either the Move Transactions window or the Open Move Transaction Interface. When you move assemblies from the queue or run intraoperation steps forward to the to move, reject, or scrap intraoperation steps, or to the next operation, WIP charges all pre-assigned resources with an charge type of WIP Moveat their standard rates.
For resources with a basis of item, WIP automatically charges the resource's usage rate or amount multiplied by the resource's standard cost upon completion of each assembly in the operation. For resources with a basis of lot, WIP automatically charges the resource's usage rate or amount multiplied by the resource's standard cost upon completion of the first assembly in the operation.
You can undo the WIP move resource charges automatically by moving the assemblies from queue or run of your current operation to queue or run of any prior operation, or by moving the assemblies from the to move, reject, or scrap intraoperation steps backward to the queue or run intraoperation steps of the same operation, or to any intraoperation step of any prior operation.
WIP applies WIP Move resource transactions to multiple repetitive schedules on a line based on how the assemblies being moved are allocated. WIP allocates moves across multiple repetitive schedules based on a first in, first out basis.
Manual Resource Charges
You can charge manual resources associated with a move transaction or independent of any moves. Manual resource transactions require you to enter the actual resource units applied rather than autocharging the resource's usage rate or amount based on the move quantity. You can charge resources using that resource's unit of measure or any valid alternate. You can manually charge resources to a job or repetitive schedule provided that the job or repetitive schedule has a routing.
If you use the Move Transactions window to perform moves and manual resource transactions at the same time, then WIP displays all pre-assigned manual resources with an charge type of manual assigned to the operations completed in the move. If the resource is a person-type resource, you can enter an employee number.
In addition to the resources that appear, you can manually charge any resource to a job or repetitive schedule, even if you have not previously assigned the resource to an operation in the job or repetitive schedule. You can also manually charge resources to an operation added ad hoc by entering any resource defined for the department associated with the operation. WIP applies manual resource transactions to the first open repetitive schedule on the line.
You can correct or undo manual resource transactions by entering negative resource units worked.
Costing Resource Charges at Resource Standard
Resource charges increase WIP valuation. Here are the accounting entries for resource transactions:
Costing Labor Charges at Actual
You can charge labor charges at actual in two ways. You can enter an actual rate for the employee using the Open Resource Transaction Interface or when you define employee rates. Here are the accounting entries for labor charges using an actual or employee rate for a resource for which charge standard rate is turned off: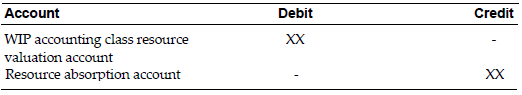
Any difference between the total labor charged at actual and the standard labor amount is recognized as an efficiency variance at period close.
If the Standard Rates check box is selected and you enter an actual rate for a resource, then the system charges the job or repetitive schedule at standard. If Autocharge is set to Manual and actual rates and quantities are recorded, then a rate variance is recognized immediately for any rate difference. Any quantity difference is recognized as an efficiency variance at period close. Here are the accounting entries for the actual labor charges:
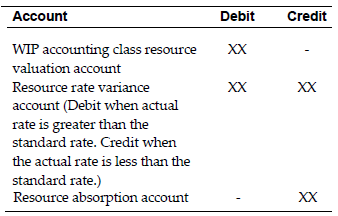
Move Based Overhead Charging
WIP automatically charges appropriate overhead costs as you move assemblies through the shop floor. You can charge overheads directly based on move transactions or based on resource charges. For overheads charged based on move transactions with a basis of item, WIP automatically charges overheads upon completion of each assembly in the operation. WIP automatically reverses these charges during a backward move transaction.
For overheads based on move transactions with a basis of lot, WIP automatically charges overheads upon completion of the first assembly in the operation. WIP automatically reverses these charges during a backward move transaction if it results in zero net assemblies completed in the operation.
Resource Based Overhead Charging
WIP automatically charges appropriate overhead costs as you charge resources. You can charge overheads based on resource units or value. WIP automatically reverses overhead charges when you reverse the underlying resource charge.
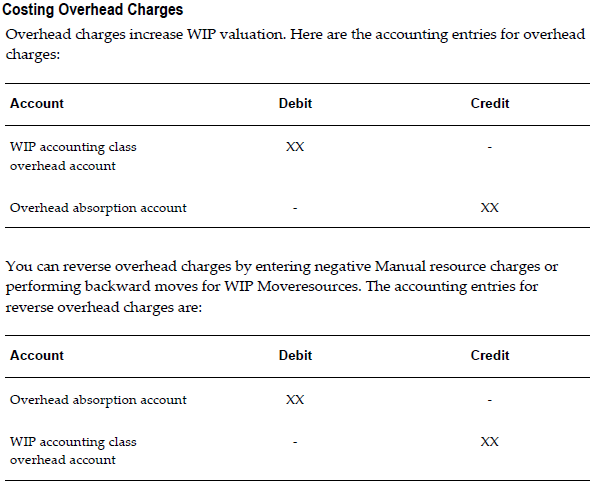
You can move partially completed assemblies that you consider unrecoverable to the scrap intraoperation step of that operation. If necessary, you can recover assemblies from scrap by moving them to another intraoperation step. By moving into the scrap intraoperation step, you can effectively isolate good assemblies from bad.
WIP considers a move into the scrap intraoperation step from the queue or run of the same operation as an operation completion, and thus updates operation completion information, backflushes components, and charges resource and overhead costs according to the elemental cost setup. You can also move assemblies back to the scrap intraoperation step of the previous operation for queue or run if no work has been completed at the current operation.
Costing Assembly Scrap Transactions
When you define WIP parameters, you can specify whether moves into the scrap intraoperation step require a scrap account. If you enter a scrap account or alias when you move assemblies into scrap, then the scrap account is debited and the job or repetitive schedule elemental accounts for the standard cost of the assembly through the scrap operation are credited. This removes the cost of the scrapped assemblies from the job or repetitive schedule. If you do not enter a scrap account or select an alias, then the cost of the scrap remains in the job or schedule until job or period close. If you recover assemblies from scrap, then the scrap account is credited and the job or repetitive schedule elemental accounts for the standard cost of this assembly through this operation are debited. Here are the accounting entries for scrap transactions:
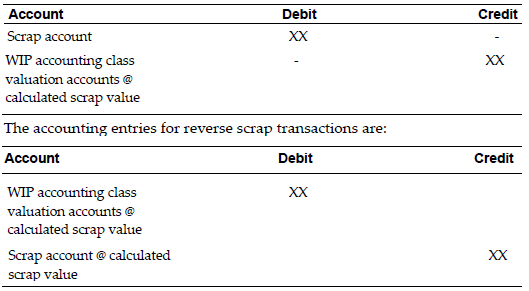
Use the Completion Transactions window, Move Transactions window, and Inventory Transaction Interface to move completed assemblies from WIP into subinventories. Completion transactions relieve the valuation account of the accounting class and
charge the subinventory accounts (for example, finished goods) based upon the assembly's elemental cost structure.
Overcompletions
If you have overcompleted a job, it is not necessary to change the job quantity. However, if you are overcompleting assemblies associated with lot based resources and overheads, these resources and overheads are over-relieved from WIP.
Costing Assembly Completion Transactions
Completions decrease WIP valuation and increase inventory valuation at standard costs. Here are the accounting entries for completion transactions:
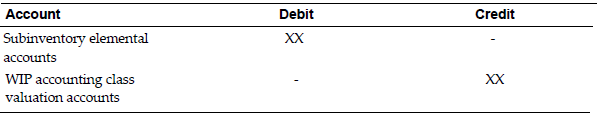
Until you close a job or change the status of the job to Complete - No Charges, you can make material, resource, and scrap charges to the job. Closing a discrete job prevents any further activity on the job.
Costing Job Close Transactions
Closing a job calculates final costs and variances. The actual close date that you specify determines the accounting period that WIP uses to recognize variances. You can back date the close to a prior open period if desired.
The close process writes off the balances remaining in the WIP elemental valuation accounts to the elemental variance accounts that you defined by accounting class, leaving a zero balance remaining in the closed job. If there is a positive balance in the job at the end of the close, here are the accounting entries for a job close:
Account Debit Credit
WIP accounting class variance accounts XX -
WIP accounting class valuation accounts - XX
The period close process in Inventory recognizes variances for non-standard expense jobs and repetitive schedules. It also transfers the WIP period costs to the general ledger.
Costing Nonstandard Expense Job Period Close Transactions
You can close discrete jobs and recognize variances for non-standard expense jobs at any time. In addition, the period close process automatically recognizes variances on all non-standard expense job charges incurred during the period. Therefore, open non-standard expense jobs have zero WIP accounting balances at the start of a new period.
If there is a positive balance in the job at the end of the period, here are the accounting entries for nonstandard expense jobs at period close:
Account Debit Credit
WIP accounting class variance accounts XX -
WIP accounting class valuation accounts - XX
Costing Repetitive Schedule Period Close Transactions
You do not close a repetitive schedule. However, you do recognize variances on a period basis that result in zero WIP accounting balances at the start of the new period. You should check your transactions and balances using the Repetitive Value Report before you close a period.
When you define WIP parameters, you can specify which repetitive schedule variances that you recognize when you close an accounting period. You can either recognize variances for all repetitive schedules when you close an accounting period, or recognize variances for those repetitive schedules with statuses of either Complete - No Charges or Cancelled.
Assuming positive balances in the repetitive schedules at the end of the period, here are the accounting entries for repetitive schedules at period close:
Account Debit Credit
WIP accounting class variance accounts XX -
WIP accounting class valuation accounts - XX
The standard cost update process revalues standard and non-standard asset discrete jobs and updates pending costs to frozen standard costs. Repetitive schedules and non-standard expense jobs do not get revalued by the cost update.
The cost update creates accounting transactions by job and cost element valuation account. Each standard and non-standard asset discrete job is updated using the following formula:
Standard cost update adjustment = [new costs in (material, resource, outside processing, and overhead charges) - new costs out (scrap and assembly completion charges)] - [old costs in (material, resource, outside processing, and overhead charges) - old costs out (scrap and assembly completion charges)]
If the result of the cost update is an increase in the standard cost of the job, here are the accounting entries for a cost update transaction:
Account Debit Credit
WIP accounting class valuation accounts XX -
WIP Standard cost adjustment account - XX
If the result of the cost update is a decrease in the standard cost of the job, here are the accounting entries for a cost update transaction:
Account Debit Credit
WIP Standard cost adjustment account XX -
WIP accounting class valuation accounts - XX
When the cost update occurs for open jobs, standards and WIP balances are revalued according to the new standard, thus retaining relief variances incurred up to the date of the update.
WIP automatically creates resource transactions at the standard or actual rate for all outside processing resources with an charge type of PO Receipt or PO Move when you receive assemblies from an outside processing operation back into WIP, using the Enter Receipts window in Purchasing. For outside processing resources with an charge type of PO Move, WIP also performs a move of the assemblies from the queue or run intraoperation step of your outside processing operation into the queue intraoperation step of your next operation or into the to move intraoperation step if the outside processing operation is the last operation on your routing.
If you assigned internal resources to an outside operation with an charge type of manual, then use the Move Transactions window or the Open Resource Transaction Interface to charges these resources. If you return assemblies to the supplier, then WIP automatically reverses the charges to all automatic resources associated with the operation. You must manually reverse all manual resource charges using the Move Transactions window.
For outside processing resources with an charge type of PO Move, WIP automatically moves the assemblies from the queue intraoperation step of the operation immediately following the outside processing operation into the queue intraoperation step of your outside processing operation.
If the outside processing operation is the last operation on your routing, then WIP automatically moves the assemblies from the to move intraoperation step to the queue intraoperation step. WIP applies PO Move resource transactions to multiple repetitive schedules on a line based on how the assemblies being moved are allocated. WIP allocates moves across multiple repetitive schedules based on a first in, first out basis. WIP applies PO Receipt resource transactions to the first open repetitive schedule on the line.
Costing Outside Processing Charges at Standard
When you receive the assembly from the supplier, Purchasing sends the resource charges to WIP at either standard cost or actual purchase order price, depending upon how you specified the standard rate for the outside processing resource.
If the Standard Rates option is enabled for the outside processing resource being charged, then the application charges WIP at the standard rate and creates a purchase price variance for the difference between the standard rate and the purchase order price. Here are the accounting entries for outside processing items:
Account Debit Credit
WIP accounting class outside processing valuation account XX -
From the Discrete Workstation, you can issue components, move assemblies, complete assemblies and operations, and charge resources without having to return to the main menu. You can either perform the transactions directly on the workstation tabs, or open the appropriate Work in Process window for that transaction.
Issue Components
To issue components to a job from the workstation, you choose the Issue Components button, which opens the WIP Material Transactions window. All relevant job information is automatically defaulted into the window from the workstation.
Move Assemblies
You can perform simple assembly Move transactions directly on the Assembly Move tab graphic using the mouse. The graphic displays a bucket for each intraoperation step, and uses a red ball to represent the assembly quantity. You move assembly quantities from one intraoperation step to another. by dragging the red ball to the bucket at that step.
When you move the assemblies, a window opens so that you can indicate the quantity that you want to move. The assembly quantity at each intraoperation step is displayed numerically above the step, and changes to reflect the number of assemblies that you move in or out of that step.
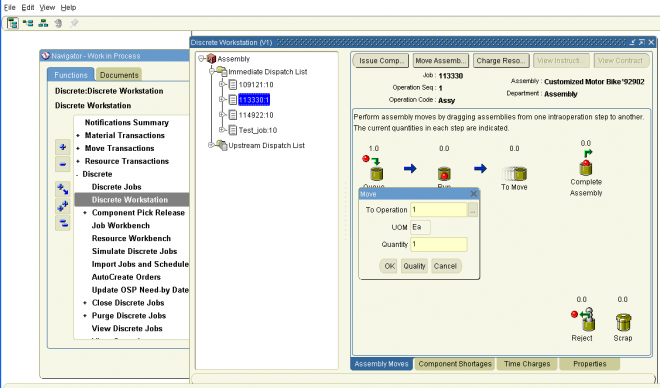
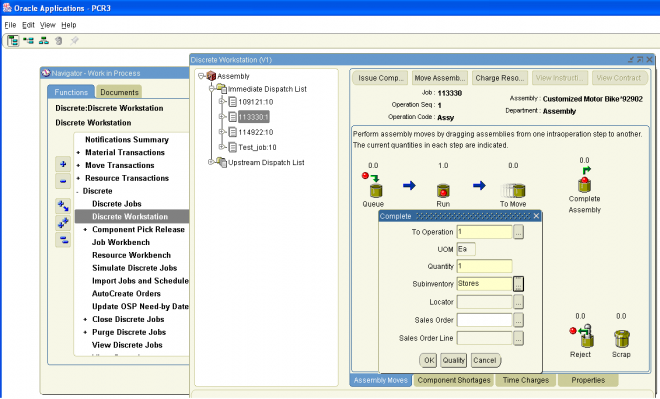
Utilization Graph
The Utilization tab displays in graph and table format, the department’s or resource’s daily percent utilization during the past five days (the default date range), or during a date range that you select. The top section of the tab displays the name of the department or resource and its description, and provides you with two Date fields that you can use to change the date range of the graph.
The Utilization graph displays as a percentage the hours the department or resource was actually used compared to the hours it was available to be used. It shows the daily percent utilization of the resources within the selected department, or of a particular resource across all departments, depending on whether you chose to view a department or a department/resource when you launched the workstation.
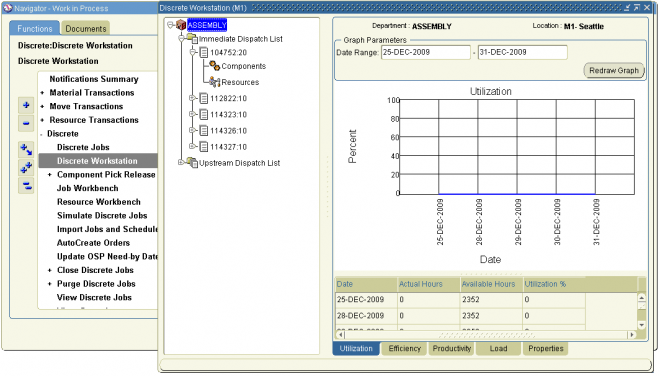
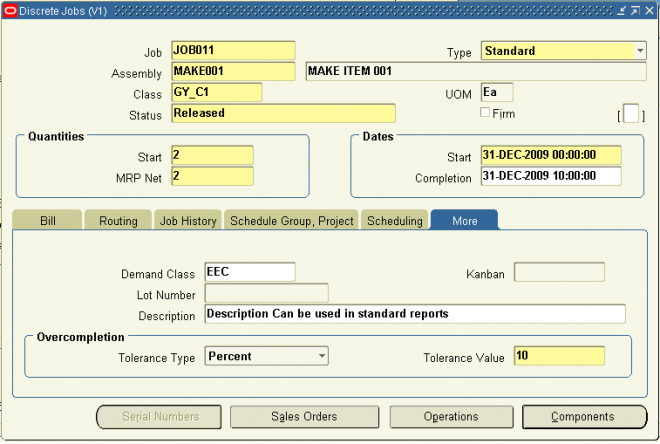
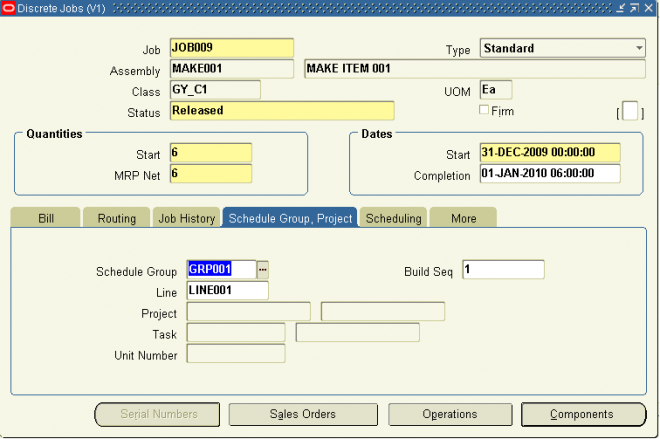 :
:If you have installed Oracle Manufacturing Scheduling, you can use the fields on this tab to change scheduling information
defaulted from the WIP Parameters window. To enable this functionality, select the Constraint Based Scheduler check box on the Scheduling tab of the WIP Parameters window.
Warning: Do not check the Constraint Based Schedule check box unless you have installed Oracle Manufacturing
Scheduling.
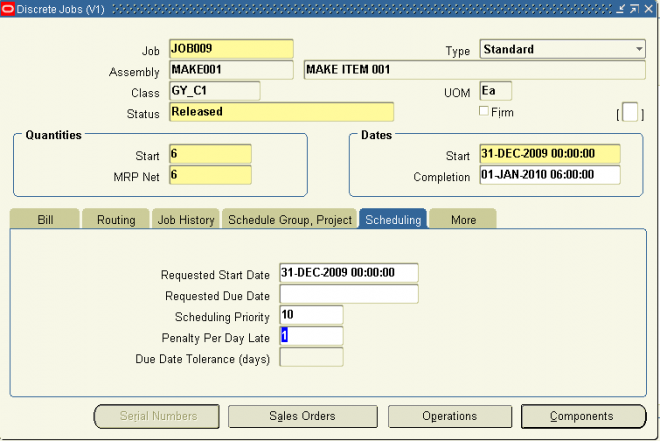
You can reserve assemblies on a Discrete job for a specific sales order line whether or not the assemblies are Assemble–to–Order (ATO) items. You link both standard and non–standard Discrete jobs to sales orders by selecting one or more sales orders from the Sales Order window when you create the job. You can link one or more sales order lines with one or more jobs.
You can also enter the demand class for the job to help you track production by sales channel. When you are building final assembly orders, the demand class is automatically loaded based on the customer. You can enter any valid demand class.
When linking ATO sales orders and jobs, however, the following rules are applied:
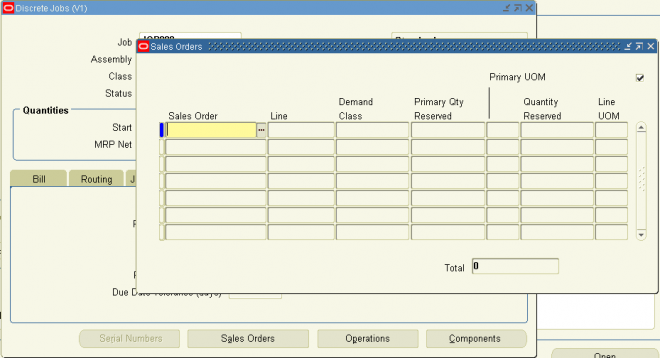
You can track your jobs using serial control throughout the manufacturing process. This enables you to assign and associate serial numbers to a job, and track the assembly by serial number as it progresses on the shop floor. Serial number tracking is enabled for discrete jobs, both standard and non–standard. This feature also includes:
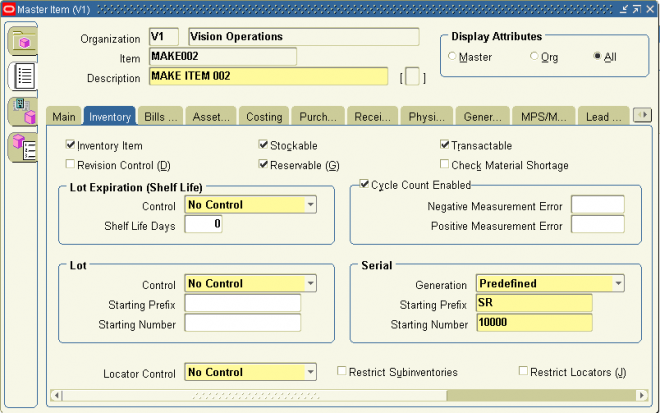
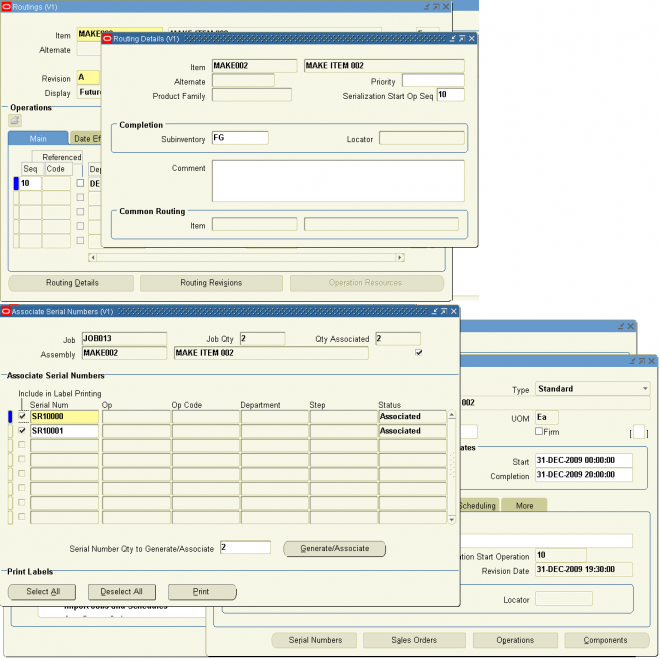
Steps involved in building discrete jobs include:
1. Releasing jobs to production.
2. Issuing components to jobs and, if necessary, returning them back to inventory.
3. Using Shop Floor Control to coordinate, on an as required basis, the following:
– Moving assemblies between routing operations and intraoperation step.
– Scrapping assemblies.
– Backflushing or issuing and returning operation pull and assembly pull components automatically with move transactions
– Charging resources.
4. Changing jobs to accommodate changes in production.
Note: If you have Oracle Shop Floor Management installed, you can use lot based jobs in your manufacturing. The entire
quantity of a lot based job moves on the basis of the network routing.
Releasing Discrete Jobs
You must release a job to production before transacting against it. Releasing a discrete job with a routing automatically loads the job quantity into the Queue intraoperation step of the first operation. If PO Move or PO Receipt resource requirements exist at the first operation, purchase requisitions for these resources are automatically generated.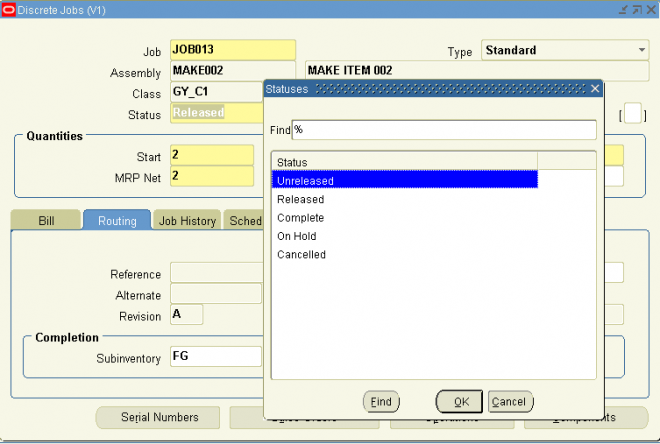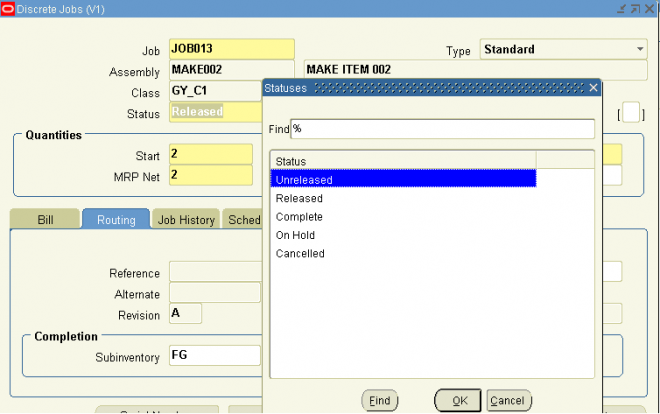
You can use the Transaction Summary window to determine if there are pending transactions or unprocessed documents associated with a job. You cannot purge or close jobs if pending transactions or unprocessed documents exist. In some instances, you also cannot change a job from one status to another. For example, you cannot change jobs from a Released to an Unreleased status if pending information exists
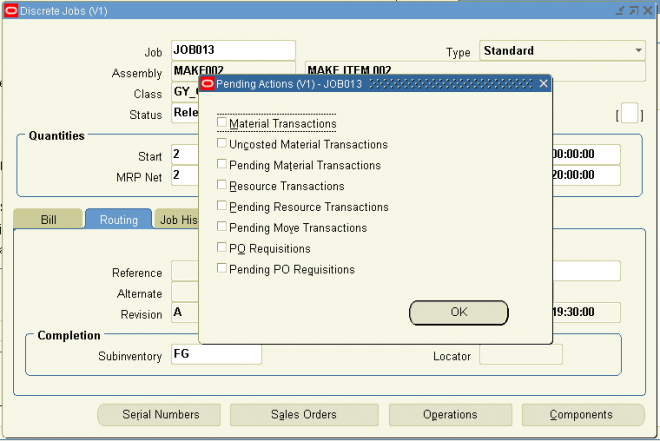 .
.You can make the following changes to your discrete jobs:
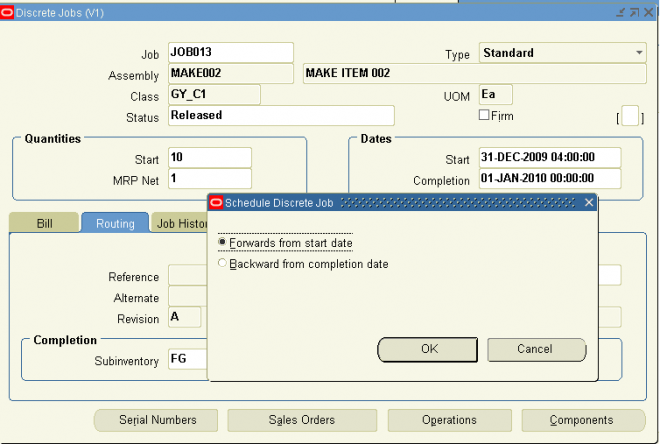
You can make the following changes to your discrete jobs:
You can make the following changes to your discrete jobs:
You can make the following changes to your discrete jobs:
You can simulate a standard job to determine what materials, operations, and operation resources are required to support that job.
You can specifically do all of the following:
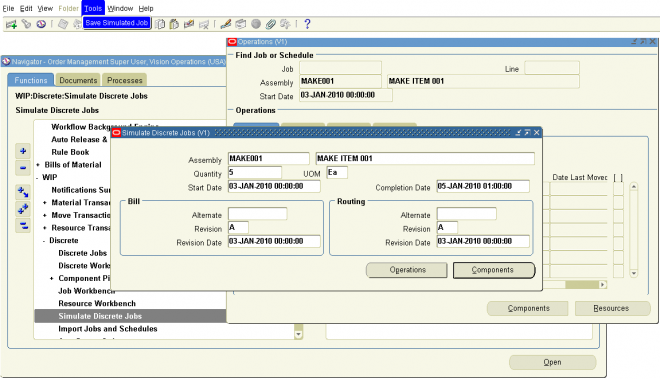
You can simulate a standard job to determine what materials, operations, and operation resources are required to support that job.
You can specifically do all of the following:
You can simulate a standard job to determine what materials, operations, and operation resources are required to support that job.
You can specifically do all of the following:
You can simulate a standard job to determine what materials, operations, and operation resources are required to support that job.
You can specifically do all of the following:
You complete job assemblies into inventory using the Completion Transactions and Move Transactions windows. You also use these windows to return completed assemblies back to jobs. When you complete or return assemblies, any remaining quantities are automatically updated. Note: You can also complete Work in Process assemblies using the Inventory Transaction Interface and the Open Move Transaction Interface.
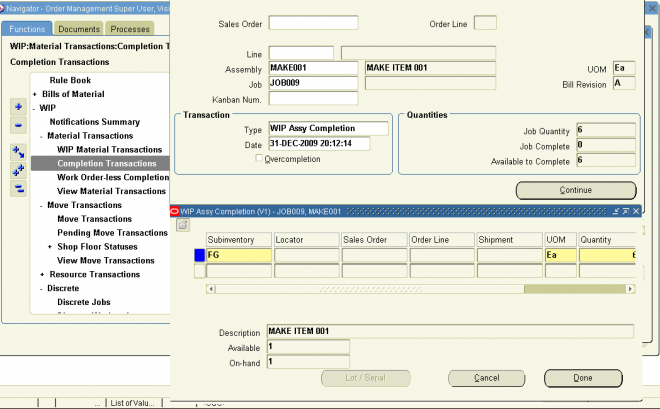
You complete job assemblies into inventory using the Completion Transactions and Move Transactions windows. You also use these windows to return completed assemblies back to jobs. When you complete or return assemblies, any remaining quantities are automatically updated. Note: You can also complete Work in Process assemblies using the Inventory Transaction Interface and the Open Move Transaction Interface.
You complete job assemblies into inventory using the Completion Transactions and Move Transactions windows. You also use these windows to return completed assemblies back to jobs. When you complete or return assemblies, any remaining quantities are automatically updated. Note: You can also complete Work in Process assemblies using the Inventory Transaction Interface and the Open Move Transaction Interface.
You complete job assemblies into inventory using the Completion Transactions and Move Transactions windows. You also use these windows to return completed assemblies back to jobs. When you complete or return assemblies, any remaining quantities are automatically updated. Note: You can also complete Work in Process assemblies using the Inventory Transaction Interface and the Open Move Transaction Interface.
Oracle Work in Process is a complete production management system. Work in Process is part of Oracle Applications, an integrated suite of business solutions. Work in Process supports discrete, repetitive, assemble-to-order, work order-less, project or a combination of manufacturing methods. Inquiries and reports give you a complete picture of transactions, materials, resources, costs, and job and schedule progress.